Previous StormForge platform updates
For the latest updates, see StormForge platform updates.
UI enhancements
Added
-
New graph: OOM Events
On the Reports page, a new OOM Events graph shows the count of OOMKills over time across the estate. Use the filters at the top of the page to filter by cluster and time period.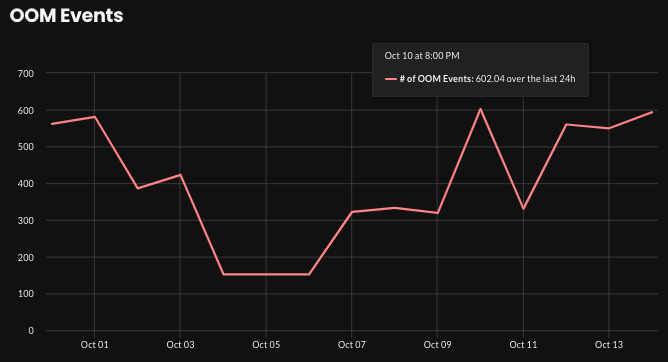
UI enhancements
Added
-
Learning period shown on Schedule page
You can now view a workload’s learning period on the Settings > Schedule section of workload’s details page. The learning period defines how long Optimize Live observes a new workload before providing recommendations that can be auto-deployed.To adjust the learning period, you can set a cluster, namespace, or workload default by setting the
live.stormforge.io/learning-periodannotation.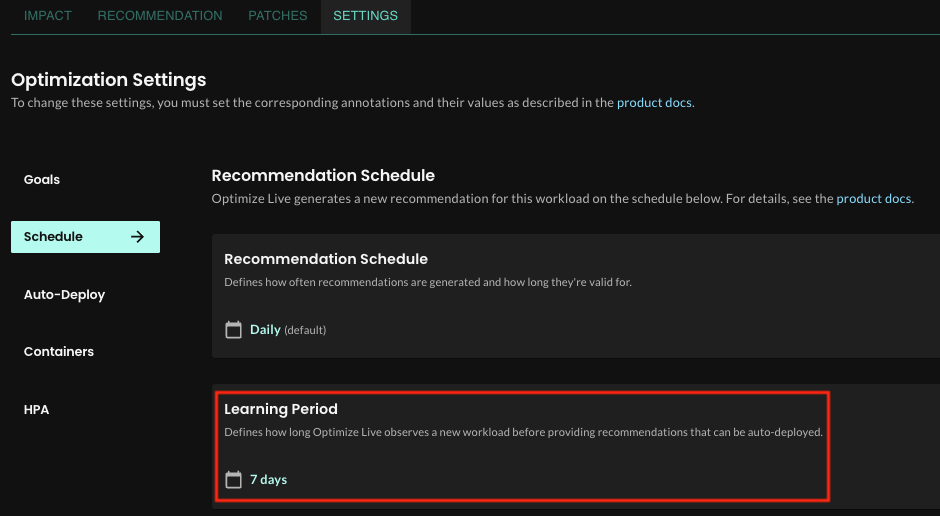
UI enhancements
Added
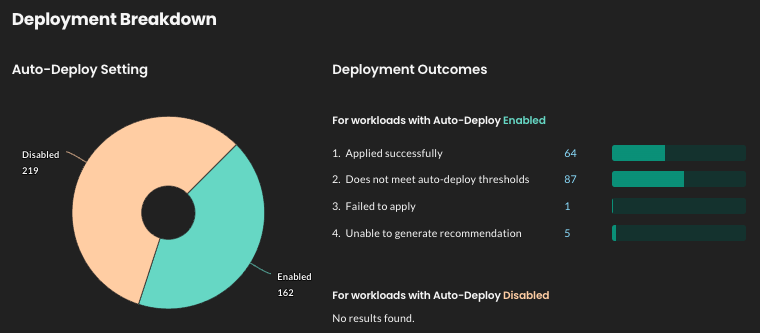
- Deployment breakdown graph
A new graph on the Workloads Summary page shows the following workload and deployment information:-
The proportion of workloads that have auto-deploy enabled vs. disabled
-
Deployment outcome counts
-
UI enhancements
Added
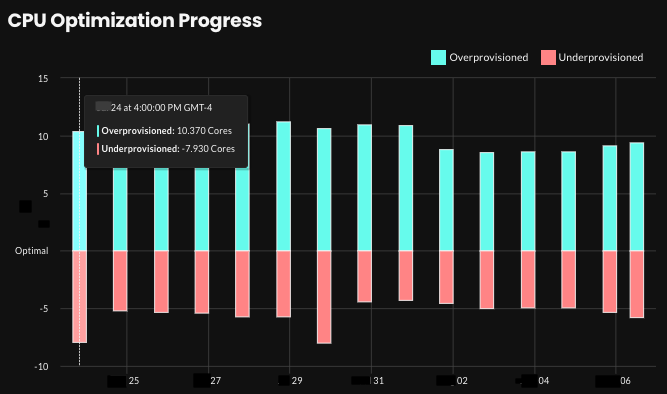
- Graphs showing overview data over time
On the new Reports page, you can now view graphs that show recommendation impact data for your entire estate over a time range of 2 weeks, 1 month, or 3 months:-
Current and recommended requests totals for both CPU and memory
-
Optimization progress showing the number of overprovisioned/underprovisioned workloads
-
Estimated monthly resource costs
-
Workload count
Example:
-
Changed
-
Improved recommendation details view
On the Recommendation tab on the workload details page, recommended container values are now stacked along the left side of the pane, making it easier to view recommended values. Clicking a container name still reveals the Average CPU/Memory Usage, Requests, and Limits graphs.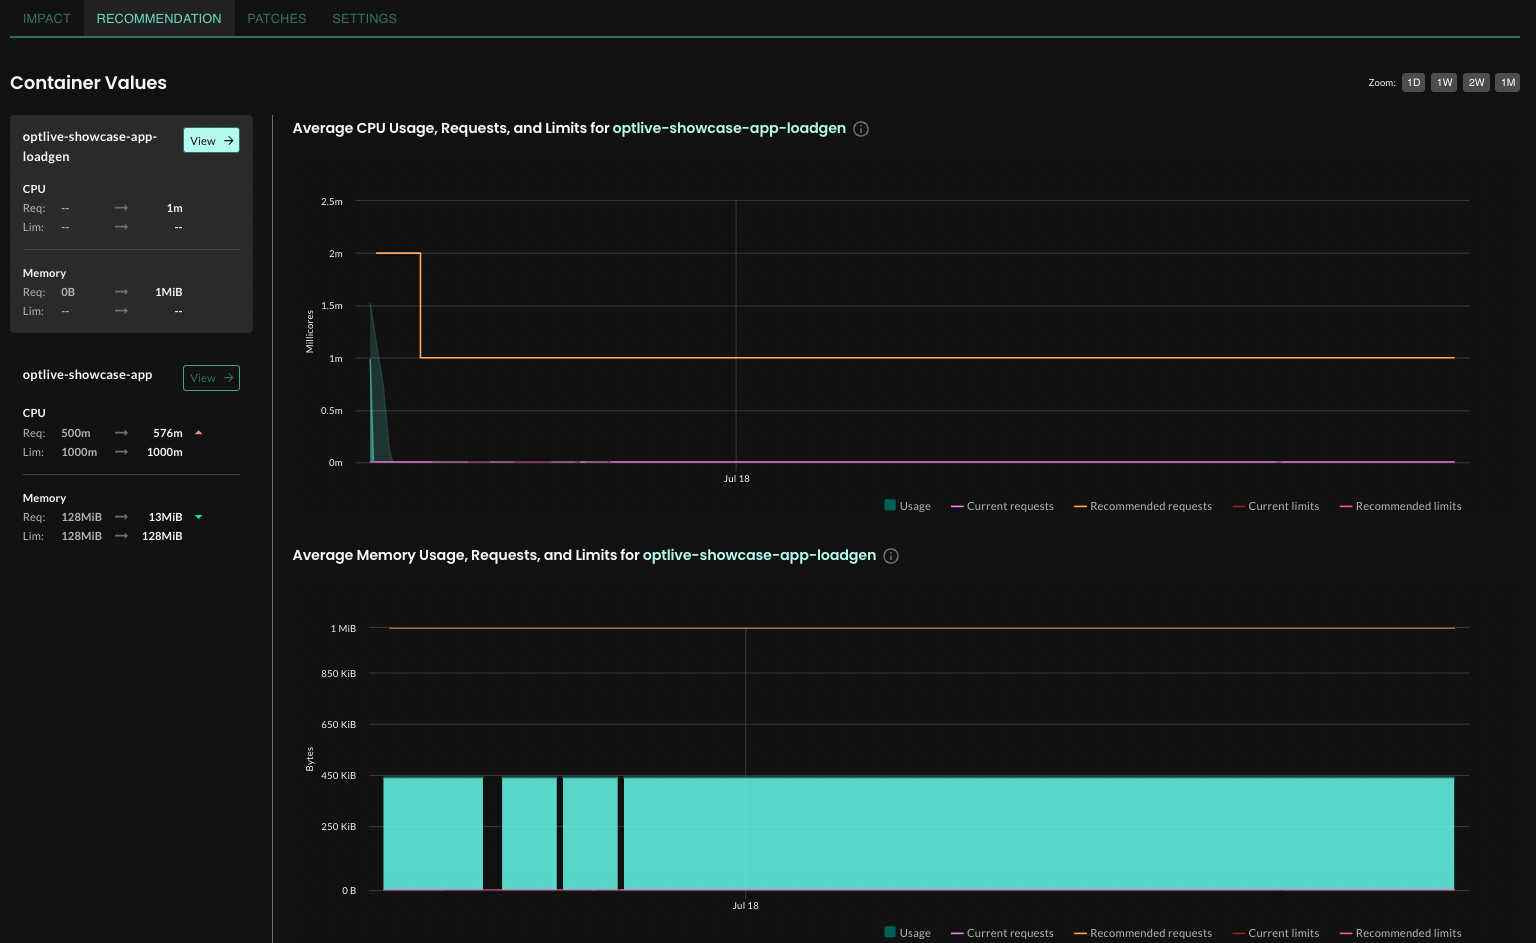
UI enhancements
Changed
-
Get Started improvements
You no longer have to save the generated Yaml values file when you install.
Simply provide a cluster name, run the generatedhelm installcommand, and click Check Connection. -
Optimization settings improved layout
On a workload’s Config tab, settings are now read-only and grouped as shown in the image below. To change these settings, use annotations as shown in the examples provided.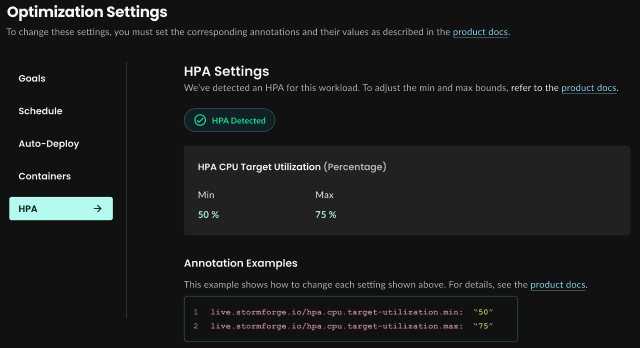
UI enhancements
Changed
- Improved recommendation impact charts
-
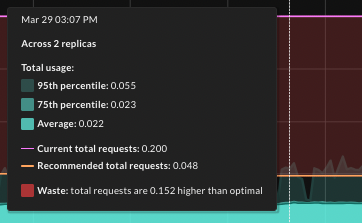
Shading for Usage now includes the 95th and 75th percentile total usage in addition to average total usage.
-
Shading for Net impact more clearly explains the “gap” between current and recommended requests settings.
-
Chart tooltips on the Impact tab now include Waste (overprovisioning) or Performance risk (underprovisioning) details, as shown below.
-
UI enhancements
Added
-
Easier to understand recommendation impact information
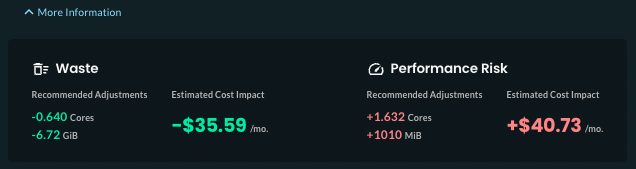
Redesigned page headers on the Overview, Cluster, and Namespace pages make it easier to understand projected savings at each level.The new Optimization Score measures how well the current request settings align with Optimize Live’s recommendations (100 indicates perfect alignment). This score replaces the Overall Efficiency score.
In the page header, click More Information to reveal the recommended CPU and memory adjustments and their estimated cost impact.
-
RBAC: View-only role now available
Administrators and managers can now assign users to a Viewer role. Viewers can export patches and have view-only access for recommendations, workload configurations, cost estimates, and cluster management information. By default, new users are assigned the Administrator role.In the left navigation, click Settings > Users. In the Actions column, click Set Role, and choose Viewer.
-
View and download workload and HPA patches
On the workload details page, click the View Patches tab. You can also copy the generatedkubectl patchcommand to apply the patch. -
Other UI improvements
- New or improved error messages for some scenarios.
- On the workload details page:
- The page header shows Kubernetes workload type (Deployment, Daemonset, and so on).
- Graphs on the Impact and Recommendation Details tabs now use a consistent date format (MMM DD).
- Autodeployment thresholds configured by the Agent are now shown on the Config tab.
Removed
- Cost Estimates page: Show/hide costs toggle
As part of the new page header design, dollar amounts are now always shown.
UI enhancements
-
New: Workloads Summary page
You can now view workload totals categorized by workload status, errors, and warnings.In the left navigation menu, click Workloads.
UI enhancements
UI enhancements when working with workloads:
-
Impact Overview graphs: Choose a time range
On the Impact tab of a workload details page, you can now zoom in or out to view different data points and the potential recommendation impact across different time intervals: 1 day, 1 week, 2 weeks, or 1 month.

-
Configure page: Enhanced validation of requests values
We now do more checks on the requests values that you enter. Most notably, we let you know if a CPU or memory value seems unexpectedly high or low.
UI enhancements
-
Launch from the left navigation
Launch or switch between Optimize Live and Optimize Pro from the left navigation rather than from the tabs within an application. This update takes you to your applications and recommendations faster.
UI enhancements
On the Configure Recommendations page:
- In the Optional Settings section, you can now specify the CPU target utilization of the HPA recommendation.
- In the Advanced Settings section, you can choose either of the following:
- Enable Guaranteed Quality of Service.
- Exclude Memory Limits, CPU limits, or both from recommendations.
To access the Advanced Settings, contact your StormForge sales rep.
UI enhancements
- Added a progress bar that shows the progress of the TSDB backfill
- Added support for maximum CPU and memory limits
- Added a clusters list page