StormForge
To get the latest Agent and Applier versions, see the Upgrade topic.
Version 3.0.0
Version 3.0.0 unifies all StormForge components into a single Helm chart. Upgrading from the v2 Agent and Applier charts requires migration — see Migrate v2 → v3.
Added
-
Unified
stormforgeHelm chart: New chart that bundles the workload-agent and the applier in a single installation, replacing the separatestormforge-agentchart. Required values are the same (clusterName,authorization.clientID,authorization.clientSecret). Breaking change — replacesstormforge-agent. -
workloadResourceKindsmodel: A single list replaces the two parallel v2 parameters (workloadResourceTypes+ownerResourceTypes). Each entry carries an explicitrolefield —workload,conditionalWorkload,owner,ignoredOwner— eliminating the ambiguity of separate lists.patchTargetDefaults(renamed frompatchTargetTypeDefaults) is set per entry; the chart injects the requiredlive.stormforge.io/prefix internally. Breaking change — see Migrate v2 → v3. -
includeCommonAddOnResourceKinds: ReplacesincludeCommonAddOnResourceTypes, enabled by default. Prepends curated entries for Argo Rollouts, Prometheus operator, OpenTelemetry collector, KEDA, and Dynatrace.
Changed
-
CRDs are now Helm-managed: CRDs moved from
crds/totemplates/crds/so they upgrade in lockstep with the chart.crds.enabled(defaulttrue) opts out for out-of-band CRD management;crds.keep(defaulttrue) prevents cascade-delete on uninstall. Breaking change — upgrade note below. -
cAdvisor scrape method auto-detected: The
CadvisorDirectScrapeconfig flag is removed. The scrape method is now inferred automatically from theinstancelabel on incoming PSI metrics. -
PSI waiting-rate uses a time-weighted window: The fixed-sample-count ring buffer is replaced with timestamped samples averaged over a configurable
WaitingAverageWindow. TheSampleIntervalconfig field is removed; setWaitingAverageWindow(default10m) instead. Stale samples outside the window are excluded regardless of scrape cadence changes.
Upgrade note — CRD ownership transfer
CRDs previously installed from the crds/ directory carry no Helm ownership metadata. The first helm upgrade onto v3.0.0 may fail with “invalid ownership metadata.” Remediation options:
- Helm ≥ 3.17: run the upgrade once with
--take-ownership - GitOps / older Helm: label and annotate the existing CRDs before upgrading:
kubectl label crd <name> app.kubernetes.io/managed-by=Helm --overwrite
kubectl annotate crd <name> \
  meta.helm.sh/release-name=<release> \
  meta.helm.sh/release-namespace=<namespace> --overwrite
Version 2.15.2-applier
Security
- Go 1.26.4 toolchain and
x/cryptoupdate: Bumpinggithub.com/gramLabs/go-applicationtov0.0.118transitively updates the Go toolchain to1.26.4andgolang.org/x/cryptotov0.52.0, picking up all security fixes included in those releases.
Version 2.28.2-agent
Changed
- Dependency updates
Version 2.15.1-applier
Changed
- Dependency Updates
Fixed
- Fixed an issue where
WebhookImmediateRolloutapply method while handling fallback on In-Place-Pod-Resize failure, might not deploy the correct recommendation across pod admission.
Version 2.15.0-applier
Added
- Suspend capability: New
suspendHelm parameter disables applier behavior at runtime without scaling down the Deployment or removing the webhook server. Allowed values:None(default),NewRecommendations,All. Invalid values are rejected at startup. WhenAll, the webhook returnsAllowedimmediately after decode so theMutatingWebhookConfigurationstays responsive.
Changed
- Event reason renames
(breaking): All applier event reason strings have been renamed to use StormForge domain language. Dashboards, alerts, or tooling that filters on old reasons must be updated:PatchAppliedRecommendationAppliedPatchFailedRecommendationApplyFailedPatchRolledBackRecommendationRolledBackRollbackFailedRecommendationRollbackFailedDriftDetectedRecommendationDriftDetectedDriftReconciledRecommendationDriftReconciledValidationFailed(unrecoverable)RolloutValidationAbandonedValidationTimedOutRolloutValidationTimedOut
Version 2.14.0-applier
Added
- Centralized Kubernetes Event Emission
Changed
- Dependency Updates
Version 2.28.1-agent
Changed
- Add RBAC for OpenShift operator-owned workloads when
openshift=true. - Update prometheus container version to 3.11.2
- Dependency Updates:
- kubernetes library group to 0.35.4.
prometheus/prometheusto 0.311.2.gramLabs/go-applicationto 0.0.115.gramLabs/stormforge-goto 4.9.1.
Version 2.13.0-applier
Added
- Adds Drift Reconciliation for Horizontal Pod Autoscalers
- Detects when StormForge Recommendations are rejected because of Cluster settings and triggers rollback faster.
- Failure Conditions detected: ResourceQuota violations, LimitRange validation, and Core Pod validation
Changed
- Dependency Updates:
- kubernetes libraries to 0.35.3
argoproj/argo-rolloutsto 1.9.0rs/zerologto 1.35.0gramLabs/stormforge-goto 4.9.0gramLabs/go-applicationto 0.0.114gramLabs/structured-loggingto 0.0.7gramLabs/stormforge-agent/v2to 2.28.0.
Fixed
- Fixed an issue where Drift Reconciliation for Workloads was not retrieving the last applied recommendation sometimes.
Security
- Updated Go to 1.26.2.
Version 2.28.0-agent
Added
- Adds support for In-API Cluster Config
- Adds user-override configuration for
clusterProvider- To configure custom provider string, add the following to helm values:
clusterProvider: exampleProvider
- Adds support for custom cluster labels
- To configure cluster labels, add the following to helm values:
clusterLabels:
  key1: value1
  key2: value2
Changed
- Updated Dependencies:
go-jose/go-jose/v4to 4.1.4.prometheus/prometheusto 0.311.1.aws/aws-sdk-go-v2/service/cloudwatchlogsto 1.65.0.aws/aws-sdk-go-v2/service/lambdato 1.88.5.aws/aws-sdk-go-v2/service/s3to 1.97.3.google/cel-goto 0.28.0.gramLabs/go-applicationto 0.0.114.
Security
- Updated Go to 1.26.2.
Version 2.27.4-agent
Added
- Adds new metrics:
- container_cpu_cfs_throttled_periods_total
- container_cpu_cfs_periods_total
- Adds ability to configure Auth credentials secret and env in Helm.
Changed
- Strictly check file-based cluster-default config on startup and fail if invalid.
- Dependency Updates:
golang.org/x/oauth2to 0.36.0k8s.io/klog/v2to 2.140.0gruntwork-io/terratestto 0.56.0google.golang.org/grpcto 1.79.3argoproj/argo-rolloutsto 1.9.0gramLabs/go-applicationto 0.0.113gramLabs/stormforge-go/v4to 4.9.0gramLabs/structured-loggingto 0.0.7
Version 2.12.2-applier
Changed
- Dependency Updates:
gramLabs/go-applicationto 0.0.112.
Fixed
- Fixed a bug that causes Applier to panic when applying pod resize to ArgoRollouts.
- Allows webhook cert-controller to be disabled.
Security
- Updated Go to 1.26.1.
golang.org/x/oauth2to 0.36.0.
Version 2.12.1-applier
Changed
- Improved RBAC scope of the applier
- Improve Webhook TLS and certificate management
- Dependency Updates:
- kubernetes libs to
0.35.2. - stormforge-agent libs to 2.27.3
- kubernetes libs to
Version 2.27.3-agent
Changed
- Enables Optimization CRDs by default.
- Updated default prometheus container image to 3.10.0.
- Dependency Updates:
filippo.io/edwards25519to 1.1.1.prometheus/prometheusto 0.310.0.- kubernetes libs to 0.35.2.
Fixed
- Fixed a bug where the Agent could send duplicate StatusChanges for a workload, causing an error.
- Fixed several Helm issues
Version 2.12.0-applier
Added
-
In-Place-Pod-Resize Support
- To enable, set the workload’s
apply.methodsetting toWebhookImmediateRolloutorWebhookHybridRollout.WebhookImmediateRollout- Use a mutating webhook to modify Pods at admission. Existing pods will be resized in place when a new recommendation is applied. If Pods cannot be resized in place, a rollout/restart will be triggered.WebhookHybridRollout- Use a mutating webhook to modify Pods at admission. Existing pods will be resized in place when a new recommendation is applied. If Pods cannot be resized in place, changes will be deferred until the next rollout.
- To enable, set the workload’s
-
HPA Reconciliation - Applier will watch, detect, and reconcile any drift in HPA
TargetUtilizationsetting.- To enable this via helm:
reconciliation:
  mode: EventBased
  controllers:
  - resource: hpa
    enabled: true
- Restart of the Applier when the ConfigMap changes.
Changed
- Updated Dependencies:
- kubernetes libraries to 0.35.1.
golang.org/x/oauth2to 0.35.0.sigs.k8s.io/structured-merge-diff/v6to 6.3.2.argoproj/argo-rolloutsto 1.8.4.gramLabs/stormforge-agent/v2to 2.27.2.gramLabs/go-applicationto 0.0.111.gramLabs/stormforge-go/v4to 4.8.4.
Fixed
- Fixed a typo in
priorityClassNamein the helm default values file. - Invalidates recommendations that have HPA metric changes that are not metrics that StormForge optimizes (resource and container resource metrics).
Security
- Update Go to 1.25.7
Version 2.27.2-agent
Fixed
- Fixed a bug where the Agent would lose the pod-workload association if the only pod still in running state had an older generation.
Changed
- Dependency Updates:
golang.org/x/oauth2to 0.35.0.github.com/google/cel-goto 0.27.0.argoproj/argo-rolloutsto 1.8.4.gramLabs/stormforge-go/v4to 4.8.4.- kubernetes libraries to 0.35.1.
Security
- Updated to Go 1.25.7.
Version 2.27.1-agent
Added
- Added
ClusterOptimizationConfigurationandOptimizationConfigurationCustom Resource Definitions (CRDs).
This release makes these CR types available, but they are not yet enabled by default. Use the Helm parameterenableOptimizationConfigurationCRDs=trueto opt in to using them.
Changed
- Updated Dependencies:
gruntwork-io/terratestto 0.55.0.
Security
- Updated Go to 1.25.6
Version 2.26.0-agent
Added
-
Helm parameter
workloadResourceTypes: it defines CRD workload types for which support is not built-in to StormForge. It has subfieldpatchTargetTypeDefaultsto define patchpaths. -
Helm parameter
ownerResourceTypes: it defines configuration for types which may own workloads. This parameter can be used to define default patch-paths for each owner type, to define owner types to ignore (treat as if they do not own workloads), or types at which to stop owner reference traversal. The subfields arestopTraversal,ignoreOwnerandpatchTargetTypeDefaults
Deprecated
- Helm value
patchTargetTypes. UseworkloadResourceTypesinstead.
Version 2.11.0-applier
Changed
- Attention: mutation webhook is now enabled by default with
webhook.enabled=truepart of the helm values file. If one does not want to have the mutation webhook feature enabled, one needs to specifywebhook.enabled=false - Expose applier metrics via port 8080 as part of the webhook service
- Bumped K8s libraries to 1.35
Added
- Helm parameter to support network policies:
networkPolicies.create=trueand optionally for egress network policynetworkPolicies.additionalEgressRuleswith sample example on file
Security
- Addressed CVE-2025-61729
Version 2.25.1-agent
Added
- Sample egress network policy on helm values file
Changed
- Bumped prometheus common library to latest version
- Bumped prometheus to
v3.9.1
Fixed
- A config parse condition when specifying
clusterDefaultsAutoDeployExemptNamespacesthat cause agent not to start - in rare occasions, fixed missing “selector” field on HPA external metrics.
Security
- Addressed CVE-2025-61729
Version 2.10.1-applier
Security
- Addressed CVE-2025-68156
Version 2.25.0-agent
Added
-
Helm Parameter
clusterDefaultsAutoDeployExemptNamespaces
This new Helm parameter defines a list of namespaces for which theauto-deploysetting defined in the cluster-defaults ConfigMap will be ignored.This parameter has a default value of
["^kube-system$", "^openshift.*"]. Workloads in namespaces matching these regular expressions will not be subject to theauto-deploysetting defined in cluster-defaults. To enableauto-deployon workloads in affected namespaces, you must use a namespace annotation, or a workload annotation.To modify this behavior, set the parameter to
nullor to a list of regular expressions that you define.
Changed
-
Helm Parameter
workload.denyNamespaces
The default value for this parameter is nownull. StormForge will observe and create recommendations for workloads in all namespaces by default.Previously, this parameter had a default value of
["kube-system", "openshift.*"].
Security
- Addressed CVE-2025-68156
Version 2.24.4-agent
Fixed
- Fixed a Helm template ConfigMap rendering issue when using
patchTargetTypes
Version 2.10.0-applier
Added
- Added a Parameter manage Recommendation Ready Timeout. Defaults to
1H. This configurable parameter prevents stale recommendations from being applied at Applier start.
Changed
-
Dropped the de-dup logic to handle recommendation items, relying on state
-
Setting a recommendation item to
FailedtoApplywhen the recommendation does not have a patch list -
Dependency Updates:
- kubernetes libs to 0.34.3.
sigs.k8s.io/controller-runtimeto 0.22.4.golang.org/x/oauth2to 0.34.0.open-policy-agent/cert-controllerto 0.15.0.prometheus/commonto 0.67.1.spf13/cobrato 1.10.2.gramLabs/go-applicationto 0.0.108.gramLabs/stormforge-agentto 2.24.3.
Fixed
- Fixed scenario that applier needed to be restarted to reapply recommendations that are set to be “Ready” via
sf apply. The solution was changing the de-dup logic of the applier.
Version 2.24.3-agent
Added
- Added a helm parameter to dictate the setup the network policies
networkPolicies.create, default is false. Upon creation, the network policies are now functional (before the selectors were misconfigured). There is no egress policies being created by default (for such, please see the next bullet) - Added helm parameters for extra network policies
networkPolicies.additionalIngressRulesandnetworkPolicies.additionalEgressRules.
Security
- golang oauth2
0.34.0 - golang crypto
0.46.0
Changed
- KEDA 2.18.2
Version 2.24.2-agent
Added
- Added collection of network metrics if
enableCostMetrics=true.- New metric name:
container_network_transmit_bytes_total.
- New metric name:
Changed
- Updated prometheus container version to 3.8.0.
- Dependency Updates:
prometheus/prometheusto 0.308.0.spf13/cobrato 1.10.2.
Version 2.24.1-agent
Changed
- When setting
enableCostMetricsto true (default is false), the user must now unsetworkload.allowNamespacesandworkload.denyNamespaces. One can add the following lines onvalues.yaml:
  workload:
    allowNamespaces: null
    denyNamespaces: null
Security
- prometheus to version
2.7.3to mitigate CVE-2025-54388
Version 2.24.0-agent
Added
- Adds support to define custom resource types to be recognized as StormForge workloads.
- Adds support to configure PatchPaths to optimize custom workload types and operators.
Changed
- Dependency Updates:
gramLabs/go-applicationto 0.0.107.sigs.k8s.io/controller-runtimeto 0.22.4.prometheus/commonto 0.67.3.- k8s libraries to 0.34.2.
Fixed
- Fixed an issue where
patchable: falsestatus condition was being applied incorrectly.
Security
golang.org/x/oauth2to 0.33.0.golang.org/x/cryptoto 0.45.0.
Version 2.23.6-agent
Added
- [EXPERIMENTAL] One time specification of patch-paths for Custom Resource Workload Types.
- Added relabeling rules to Prometheus config to normalize opentelemetry JVM metrics to match client_java form.
Changed
- Dependency Updates:
gramLabs/go-applicationto 0.0.106.gramLabs/stormforge-goto 4.8.0.golang.org/x/oauth2to 0.32.0.sigs.k8s.io/controller-runtimeto 0.22.3.prometheus/prometheusto 0.307.3.prometheus/commonto 0.67.2kedacore/kedato 2.18.1.
Fixed
- Fixed an issue where deleting a WorkloadOptimizer CR does not update the
ManagedByfield for a Workload.
Version 2.23.5-agent
Changed
- Updated Dependencies
prometheus/prometheusto 0.306.0.gramlabs/stormforge-goto 4.7.11.- Updated
prometheuscontainer in Helm to 3.6.0.
Removed
- Removed deprecated
Secrethelm template. - Removed deprecated
autoDiscoveryparameter. - Removed support for
autoscaling/v2beta2version of HPA (no longer supported by Kubernetes). - Removed unused startupProbe license check from the stormforge pod templates.
Fixed
- Removed the aggregate view in the ClusterRole template
Security
- Go to
1.25.1to address CVE-2025-47910
Version 2.23.4-agent
Added
- [EXPERIMENTAL] Added helm chart parameter
enableCostMetricsto collect Cost Reporting metrics. Defaults tofalse.
Changed
- Update golang to 1.24.1.
- Dependencies update:
spf13/cobrato 1.10.1.spf13/pflagto 1.0.10.stretchr/testifyto 1.11.1.x/oauth2to 0.31.0.sigs.k8s.io/controller-runtimeto 0.22.1.prometheus/client_golangto 1.23.2.gramlabs/go-applicationto 0.0.105.- kubernetes libraries to 0.34.1.
Version 2.9.2-applier
Fixed
- Fixed an issue where new containers could be mistakenly added when using
DynamicAdmissionWebhookapply method.
Version 2.23.3-agent
Fixed
- Fixed a bug that resulted in the workload sync did not properly sync to the API.
Version 2.9.1-applier
Fixed
- Fixed an Argo Rollout Patch Validation failure (to mitigate Argo Rollout type convention violation)
Changed
- Dependency Updates:
gramlabs/stormforge-agentto 2.23.1
Security
- Update Go to 1.24.6 to address GO-2025-3849
Version 2.23.2-agent
Security
- Update Go to 1.24.6 to address GO-2025-3849
Version 2.23.1-agent
Changed
- Updated Prometheus Container version to 3.5.0
- Dependency Updates
prometheus/prometheusto 0.305.0.spf13/pflagto 1.0.7.- kubernetes libs to 0.33.4.
gramLabs/stormforge-goto 4.7.10.sigs.k8s.io/yamlto 1.6.0.prometheus/client_golangto 1.23.0.
Fixed
- Fixes an issue where a workload will be marked as patchable despite not having RBAC permissions.
- Fixes an issue where an unsupported workload or a workload without RBAC will cause a panic in the workload reconciler.
Version 2.9.0-applier
Added
- [Beta] Support for InPlace Pod Resizing on annotation
live.stormforge.io/apply.method=InPlacePodResizing - Added additional RBAC on Helm to support InPlace Pod Resizing
Changed
- Dependency Updates:
- controller-runtime 0.21.0
- e2e-framework to 0.6.0
- stormforge-go v4.7.9
- stormforge-agent v2.23.0
- google gnostic model v0.7.0
Security
- Go to 1.24.5
Version 2.23.0-agent
Added
- Adds support for sending metrics and configuration to optimize init-container sidecars.
- Adds default requests values for Agent-installed deployments as a starting point. Users should set higher values as needed.
Changed
- Dependencies
prometheus/prometheusto 0.304.2argoproj/argo-rolloutsto 1.8.3.gramLabs/go-applicationto 0.0.102.kedacore/kedato `2.17.1-0.20250521173204-e23ef462abb5.sigs.k8s.io/controller-runtimeto 0.21.0.gramLabs/go-applicationto 0.0.102.gramLabs/stormforge-goto 4.7.9.
Fixed
- Fixes an issue where config for
patchPathannotations did not support Ephemeral Storage.- Patch Paths can now be defined in quoted comma-delimited strings such as:
live.stormforge.io/containers.cpu.limits.patch-path: "/path1,/additional/path"
- Patch Paths can now be defined in quoted comma-delimited strings such as:
- Fixes a panic when unable to retrieve a pod from the Spark.
Security
- Go to 1.24.5.
Agent version 2.22.5
Fixed
- Fixed a WorkloadOptimizer resource issue that was preventing configuration from being applied correctly.
Version 2.8.3-applier
Added
- Add Helm parameters to set
commonMetaLabelsfor StormForge deployed resources.- Example
values.yamlconfiguration to setcommonMetaLabels:commonMetaLabels: example.com/app: stormforge
- Example
Changed
- Dependency Updates:
- kubernetes libraries to 0.33.2.
argorproj/argo-rolloutsto 1.8.3.sigs.k8s.io/yamlto 1.5.0.
Agent version 2.22.4
Added
- Added helm parameter to specify
securityContextfor StormForge deployed containers.- Example
values.yamlconfiguration to setsecurityContextfor containers in themetrics-forwarderandworkload-controllerpods.commonContainerSecurityContext: allowPrivilegeEscalation: false capabilities: drop: - ALL readOnlyRootFilesystem: true seccompProfile: type: RuntimeDefault
- Example
Version 2.8.2-applier
Added
- OLV2-2431 - Adding default requests on helm chart to set workload with Burstable QoS
Fixed
- OLV2-2426 - Applier in continuous reconciliation mode skips certain workloads
Applier version 2.8.1
Changed
- Dependencies
gramlabs/stormforge-goto 4.7.7gramlabs/go-applicationto 0.0.101gramlabs/stormforge-agentto 2.22.3
Security
golangto 1.24.3 to addressGO-2025-3563
Agent version 2.22.3
Changed
- Dependencies
go-logr/logrto 1.4.3
Security
- Upgraded Prometheus container dependency to 3.4.0 to address
CVE-2025-22871.
Agent version 2.22.2
Added
- Allows specifying multiple paths for patchPath setting:
- Example:
live.stormforge.io/containers.cpu.requests.patch-path: /path/to/target,containerA="/new/path,/alternative/path"
- Example:
- Version and build SHA on log during initialization
Changed
- A new way to run controllers: a generic workload controller instead of multiple controllers used to support replica 0 workloads. Expected faster warm up time and more data integrity on annotations on replica 0 workloads.
- Dependencies
keda/v2to 2.17.1prometheus/prometheusto 0.304.0prometheus/commonto 0.64.0kubernetes librariesto 0.33.1gramLabs/go-applicationto 0.0.100gramLabs/stormforge-goto 4.7.7
Fixed
- Potential problem of missing memory metrics when
ephemeral_storageis set.
Security
x/oauth2to 0.30.0golangto 1.24.3 to addressGO-2025-3563
Applier version 2.8.0
Added
- [EXPERIMENTAL] Configuration for Alerts for Recommendation Apply Events
Fixed
- An issue where applying a patch to an unhealthy workload continued to rollback the patch.
Changed
- Dependency updates:
gramLabs/stormforge-agentto 2.22.1kubernetes/apito 0.33.0Masterminds/sprig/v3to 3.3.0
Agent version 2.22.1
Added
- Helm parameters to support auth configuration for JVM Scrape jobs
Fixed
- We fixed an issue where the Agent would fail if API Resource discovery partially fails.
- We fixed an issue with potential deadlock in the Node Cache.
Applier version 2.7.2
Added
- Add a flag
enableFallbackToClientSideApplyto work around an issue when improper configuration on a patch target prevents us from being able to apply a recommendation using Server-Side Apply. Setting this flag totruewill result in handling errors by falling back to Client-Side Apply, which will disable automatic rollback in the event of healthcheck failures.
Changed
- Dependency updates:
x/oauth2to 0.29.0golang/jwt/v4to 4.5.2rs/zerologto 1.34.0structured-merge-diff/v4to 4.7.0argoproj/argo-rolloutsto 1.8.2prometheus/client_golangto 1.22.0controller-runtimeto 0.20.4gramLabs/stormforge-go/v4to 4.7.6gramLabs/stormforge-agent/v2to 2.22.0
Agent version 2.22.0
Changed
- Internal improvements
Engineering work to support future feature additions
Added
- Resource Request Mirroring
Enable recommendation mirroring, to support DR use cases or workloads owned by progressive delivery operators such as Flagger. Mirroring works by creating recommendations for a mirror workload based on usage metric observations of another. To configure mirroring, set themetrics-fromannotation on the mirror workload.
Agent version 2.21.2
Fixed
- Fixes an issue with hpa and pod reconciles could conflict and result in incomplete workload config.
Changed
- Updated Dependencies
golang-jwt/jwt/v5to v5.2.2argoproj/argo-rolloutsto v1.8.2rs/zerologto v1.34.0gramlabs/go-applicationto v0.0.99gramlabs/stormforge-goto v4.7.6
Agent version 2.21.1
Added
-
Recommendations for Java workloads
You can now configure the Agent to generate Java maximum heap size recommendations for each Java container in a workload, in addition to requests and limits.The following settings have been added in support of this feature:
-
Support for the
runtime:javalabel selector when setting annotations.A best practice is to use the
RequestsAndLimitsoptimization policy for Java containers, which ensures that Optimize Live can implement the desired heap size. Example:live.stormforge.io/containers.memory.optimization-policy: "balanced,runtime:java=reliability,container-a=savings" -
Annotations for defining heap size range and patch path details:
live.stormforge.io/containers.java.max-heap.min
live.stormforge.io/containers.java.max-heap.max
live.stormforge.io/containers.java.max-heap.patch-path
live.stormforge.io/containers.java.max-heap.patch-format
-
Changed
- Node optimization and reporting is now enabled by default. To disable this feature, set the
clusterDataHelm parameter tofalse. - Updated dependencies:
x/netto v0.36.0prometheus/commonto v0.63.0gramLabs/stormforge-goto v4.7.5gramLabs/go-applicationto v0.0.98kuberneteslibraries to v0.32.3
Fixed
- We made several changes to increase the Agent’s efficiency at startup.
Applier version 2.7.1
Added
- New optional Helm parameter
disableAutomaticRollback: Default value isfalse. Typically, automatic rollback is disabled only upon guidance from StormForge Support or when workloads frequently become unhealthy.
This parameter replaces the setting ofSTORMFORGE_SKIP_ROLLBACK=trueas anadditionalEnvVar. - RBAC permissions are now granted by default for Argo Rollouts, eliminating the need for additonal manual configuration.
- New optional Helm parameter
additionalEnvVarsreplacesextraEnvVars, which is now deprecated. Existing extraEnvVars settings are respected and no changes are required.
In the Agent, this parameter was deprecated in version 2.20.2. - New Helm parameters enable you to specify additional volumes and mounts to add to pods (for example, to mount custom CA bundles as part of using a transparent proxy):
additionalVolumesconfigures additional volumes that will be added to all podsadditionalVolumeMountsconfigures additional volume mounts that will be added to all containers
Changed
- Dependency updates:
evanphx/json-patch/v5to v5.9.11gomodules.xyz/jsonpatch/v2to v2.5.0go-jose/v4to v4.0.5kuberneteslibraries to v0.32.3controller-runtimeto v0.20.3x/netto v0.36.0structured-merge-diffto v4.6.0gramLabs/stormforge-agentto v2.21.1gramLabs/go-applicationto v0.0.98gramLabs/stormforge-goto v4.7.5
Agent version 2.20.2
Added
- New optional Helm parameter
additionalEnvVarsreplacesextraEnvVars, which is now deprecated. See Deprecated below. - New
sf_node_labelsmetric and improved handling of node resource usage metrics.
For the complete list metrics that StormForge collects, see the Security FAQ.
Changed
- Updated dependencies:
prometheusto v3.2.1prometheuslibraries to v0.302.0kuberneteslibraries to v0.32.2stormforge-goto v4.7.4go-applicationto v0.0.97cobrato v1.9.1client_golangto v1.21.1
Fixed
- Node controller metrics are now garbage collected.
- Fixed a typo in the Helm template.
Security
- Updated dependencies
go-jose/v4to v4.0.5x/oauth2to v0.28.0
Deprecated
extraEnvVarsHelm parameter. UseadditionalEnvVars(see Added above). ExistingextraEnvVarssettings are respected and no changes are required.
Agent version 2.20.1
Changed
- All workload metrics are now enabled by default. For a complete list of metrics, see the Security FAQ.
- Several noisy
INFO-log entries are now toDEBUG-level log entries. - Updated dependencies:
kubernetesto v0.34.2
Fixed
- We fixed the issue of missing metrics when workloads are configured with limits only and no requests.
Agent version 2.20.0
Added
-
Node metrics collection is now enabled by default.
-
New custom node metrics:
sf_node_capacity_resources: The total amount of resources that a node has.node_cpu_usage_seconds_total: Used in calculating the average cluster CPU utilizationnode_memory_working_set_byes: Used in calculating the average cluster memory utilization
For a complete list of metrics, see the Security FAQ.
Changed
- Added
namespacestouseViewRolein RBAC configuration. - Updated dependencies:
spf13/pflagto v1.0.6argo-rolloutsto v1.8.0stormforge-goto v4.7.2x/oauth2to v0.26.0terratestto v0.48.2go-applicationto v0.0.95
Fixed
- We fixed the synchronization of workload configurations and HPA deletions.
- We fixed an issue with how DaemonSets were reconciled.
- We fixed an issue that prevented memory bump-ups from being applied immediately when configured to do so.
Agent version 2.19.1
Changed
Updated dependencies:
prometheuslibrary to v0.301.0prometheus/commonto v0.62.0stormforge-goto v4.7.1go-applicationto v0.0.94
Deprecated
- Installing Prometheus 2.x via Helm is no longer supported.
Fixed
- We fixed how the Agent handles jobs that have Jobs Completions set to
null.
Security
- Updated Prometheus container to v3.1.0 to fix CVE-2024-45337 in
x/crypto.
Agent version 2.19.0
Added
- A new Helm parameter
priorityClassNameenables scheduling and priority configurations to add to all pods.
Fixed
- Better HPA detection and deletion now prevent the Agent from attempting to patch a workload if its HPA has been deleted.
- Rate limiting now prevents the Agent from making more than one recommendation request in response to a workload OOM event.
- We fixed an issue with the Helm schema validation for OptimizationPolicy.
- We updated how the Agent handles invalid credentials.
Applier version 2.7.0
Added
- New Helm parameter
priorityClassNameenables scheduling and priority configurations to add to all pods
Fixed
- Log message improvement and cleanup
Changed
- Safer recommendation rollback
The rollback operation now reverts only the changes made to fields managed bystormforgeat the time the patch was applied. Previously, in a rollback, all changes made between when the recommendation was applied and when the rollback happens were lost.
Security
Dependency updates:
kubernetesdependencies to v0.32.1go-applicationto v0.0.93stormforge-goto v4.7.0stormforge-agentto v2.18.1e2eto v0.6.0
Agent version 2.18.0
Added
- Support for adding volumes and mounts to pods
The following new Helm parameters enable you to specify additional volumes and mounts to add to pods (for example, to mount custom CA bundles as part of using a transparent proxy):additionalVolumesconfigures additional volumes that will be added to all podsadditionalVolumeMountsconfigures additional volume mounts that will be added to all containers
Changed
- Dependency updates:
stormforge-goto v4.6.1go-applicationto v0.0.93keda/v2to v2.16.1x/oauth2to v0.25.0terratestto v0.48.1controller-runtimeto v0.19.4
Agent version 2.17.0
Added
- Improved support for Argo Rollouts
Support for Argo Rollouts and built-in Kubernetes types is now equivalent.
Changed
- Dependency updates:
controller-runtimeto v0.19.3kube-apilibraries to v0.32.0deckarep/golang-setto v2.7.0prometheus/commonto v0.61.0cryptoto v0.31.0stormforge-goto v4.6.0go-applicationto v0.0.90
Fixed
- Boolean types are now parsed correctly during workload autodiscovery.
Agent version 2.16.1
Added
-
Support for applying recommendations by using a mutating admission webhook
You can now configure Optimize Live to apply recommendations via a mutating admission webhook instead of the default patch method by setting the following annotation:live.stormforge.io/apply.method: DynamicAdmissionWebhookYou can define the apply method at the cluster, namesapce, or workload level. For details, see Apply method in the Apply settings topic.
Note: A cluster administrator must enable this feature via a Helm parameter when installing the Applier. Feature-specific namespace allow/deny lists can be configured to restrict webhook usage. For details, see Enabling the DynamicAdmissionWebhook in Applier configuration help topic.
-
Support for memory bump-up in response to OOM Events
You can now configure Optimize Live to respond to OOM events with a temporary memory bump-up. You can define the min and max memory bump-up amount, as well as when to apply the bump-up.You can view OOM events on the OOM Events graph on the Reports page (example graph)
Memory bump-ups can be configured at the resourcetype level, as shown below:
live.stormforge.io/reliability.oom.memory-bump-up.apply-immediately: "Always,resource:daemonsets=Never"
live.stormforge.io/reliability.oom.memory-bump-up.max: "300Mi"
live.stormforge.io/reliability.oom.memory-bump-up.min: "50Mi,resource:deployments=40Mi,resource:daemonsets=0"
live.stormforge.io/reliability.oom.memory-bump-up.percent: "15,resource:deployments=25,resource:daemonsets=0"
live.stormforge.io/reliability.oom.memory-bump-up.period: "P2D,resource:deployments=P1D"
For details and examples, see the Reliability response topic.
Changed
- Dependency updates:
goto v1.23.3go-applicationto v0.0.89stormforge-goto v4.5.2prometheuslibrary to v0.55.1oauth2to v0.24.0kedato v2.16.0
Fixed
- We fixed the issue of unmanaged workloads not deleting HPA from the workload object when HPA was deleted.
- We fixed the issue of sidecar containers using the same resource settings as the main containers.
Applier version 2.6.0
Added
- Support for optional mutating admission webhook
Fixed
- Better handling of JSON type patches
Changed
Upgraded dependencies to the following versions:
kubernetesdependencies to v0.31.1go-applicationto v0.0.89stormforge-goto v4.5.1stormforge-agentto v2.16.1
Security
Upgraded packages include:
goto v1.23.3prometheusto v0.60.1prometheus goclient to v1.20.5golang.org/x/oauth2to v0.24.0
Agent version 2.15.3
Changed
- Updated
prometheus/commonto v0.60.1 - Updated
controller-runtimeto 0.19.1 - Reduced the wait timeout for RBAC (to minimize pod blocking operation) from 20s to 5s
Fixed
- We fixed a problem that was causing the
sf_workload_pod_container_resource_requestsmetric to drop intermittently, resulting inNo containers metrics observed for this workload in the last 10 minuteserrors and incomplete graph lines.
Agent version 2.15.2
Changed
- Upgraded Prometheus container to v2.55.0
Fixed
- We now correctly detect HPAs on clusters with open telemetry operator configured with autoscaling.
UI enhancements
Added
-
New graph: OOM Events
On the Reports page, a new OOM Events graph shows the count of OOMKills over time across the estate. Use the filters at the top of the page to filter by cluster and time period.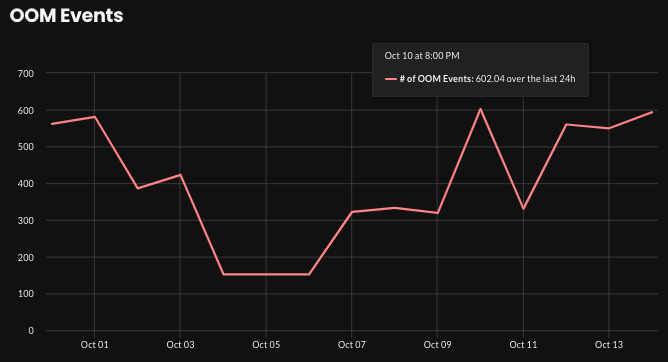
Agent version 2.15.1
Changed
Dependency updates:
kuberneteslibraries to 0.31.1stormforge-goto 4.3.3go-applicationto 0.0.86prometheus/client_golangto 1.20.4prometheus/commonto 0.60.0terratestto 0.47.2
Fixed
- Fixed the issue of the Agent not cleaning up stale metrics for deleted containers.
UI enhancements
Added
-
Learning period shown on Schedule page
You can now view a workload’s learning period on the Settings > Schedule section of workload’s details page. The learning period defines how long Optimize Live observes a new workload before providing recommendations that can be auto-deployed.To adjust the learning period, you can set a cluster, namespace, or workload default by setting the
live.stormforge.io/learning-periodannotation.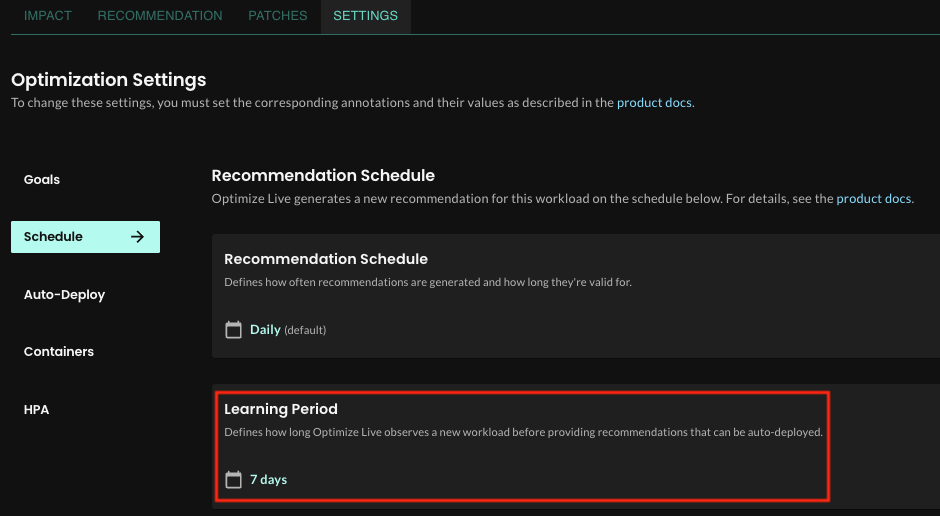
Agent version 2.15.0
Added
-
Configurable learning period
You can now configure the duration of the learning period during which Optimize Live observes a new workload before providing recommendations that can be auto-deployed (default value isP7D, 7 days). For example, a shorter learning period is helpful for branch-based deploys.To adjust the learning period, you can set a cluster, namespace, or workload default by setting the
live.stormforge.io/learning-periodannotation. You can view this setting on the Settings > Schedule section of workload’s details page.The value for this setting must be ISO-8601 compliant. Examples:
P1D: 1 day (minimum valid value)PT12H: 12 Hours
Changed
Updated the following images and libraries:
- Prometheus container image to v2.54.1
prometheuslibrary to v0.54.1prometheus/commonto v0.59.1prometheus/client_golangto v1.20.3oauth2to v0.23.0go-applicationto v0.0.83stormforge-goto v4.3.0- Golang to 1.23.1
Fixed
- Improved error message when a Network Connection or Proxy error occurs
- Noisy error log messages are now debug messages
UI enhancements
Added
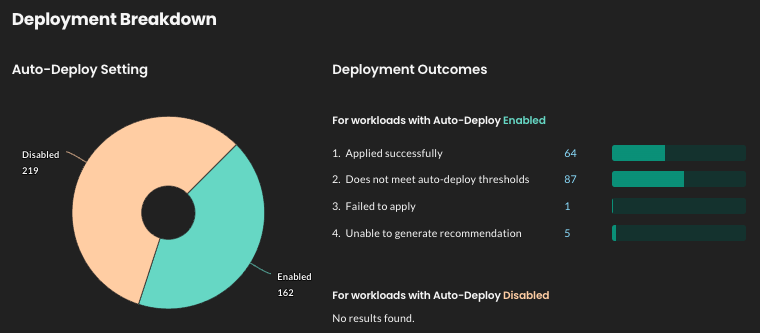
- Deployment breakdown graph
A new graph on the Workloads Summary page shows the following workload and deployment information:-
The proportion of workloads that have auto-deploy enabled vs. disabled
-
Deployment outcome counts
-
Agent version 2.14.0
Added
- CronJob controller now reconciles inactive Cronjob workload types
- Support for CronJob, ScheduledSparkApplication, and GitHubARC types.
To enable discovery and recommendations for these types, set the corresponding featureGate totrueeither via Helm or avalues.yamlfile as shown in this excerpt:featureGates: optimizeCronJobs: true optimizeSparkOperator: true optimizeGithubARC: true
Changed
- Zerolog is the standard logging mechanism. Logging arguments are now
--log-level=debugand--log-level=trace, replacing--v=<level>. - Added a name to the
workload-agentmetrics port - Updated
go-applicationto v0.0.82 - Updated
kedato v2.15.1 - Updated
structured-loggingto v0.0.5 - Updated
stormforge-goto v4.2.0 - Updated
controller-runtimeto v0.19.0
Removed
- Log arguments
--v=<level>. See Changed above for the new arguments. - The
workload.workloadResourcesHelm parameter used for enabling the workloadResource types has been replaced as described in the Added section above.
Fixed
- CronJobs: Completed pods are now garbage collected on Optimize Live metrics
Security
- Updated
grpcto v1.64.1 - Updated
golang.org/x/oauth2to v0.22.0 - Upgraded the Prometheus agent to v2.54.0 to address low- and medium-severity CVEs
Applier version 2.5.0
Changed
- Validation rollout of patches and persisting the state of the recommendation is now more reliable:
- After patches are applied, the recommendation status is either
ApplierSuccessorApplierFailed - When validating the rollout and checking workload health, the validation status is either
RolloutValidationSuccess,RolloutValidationTimeoutorRolloutValidationFailure
- After patches are applied, the recommendation status is either
- Changed the rollout validation timeout to
5m(5 minutes) from30m
Security
- Multiple packages upgraded, including
gopackage upgraded to 1.22.5 - GHSA-m5vv-6r4h-3vj9
- GHSA-v6v8-xj6m-xwqh
- GHSA-xr7q-jx4m-x55m
Agent version 2.13.0
Added
- Adds 10 minute “Learning Period” to the Agent sidecar in the Metrics-forwarder pod for faster metrics scraping after init.
- Adds a workload metric
sf_workload_terminated_totalthat tracks the count of workload termination events. Initially will only trackOOMKilledevents.
Changed
- Added a default value to authorization.issuer to the Helm chart.
Removed
- Cadvisor metric
container_oom_events_totalno longer collected.
Fixed
- Workload container order was not being preserved.
- Potential contention between DeletionPredicate and Reconcile.
UI enhancements
Added
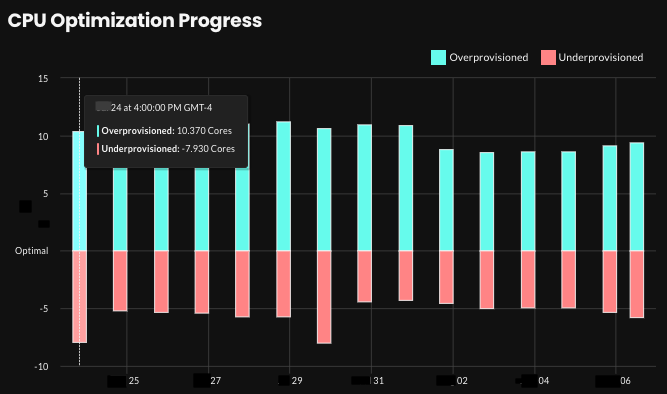
- Graphs showing overview data over time
On the new Reports page, you can now view graphs that show recommendation impact data for your entire estate over a time range of 2 weeks, 1 month, or 3 months:-
Current and recommended requests totals for both CPU and memory
-
Optimization progress showing the number of overprovisioned/underprovisioned workloads
-
Estimated monthly resource costs
-
Workload count
Example:
-
Changed
-
Improved recommendation details view
On the Recommendation tab on the workload details page, recommended container values are now stacked along the left side of the pane, making it easier to view recommended values. Clicking a container name still reveals the Average CPU/Memory Usage, Requests, and Limits graphs.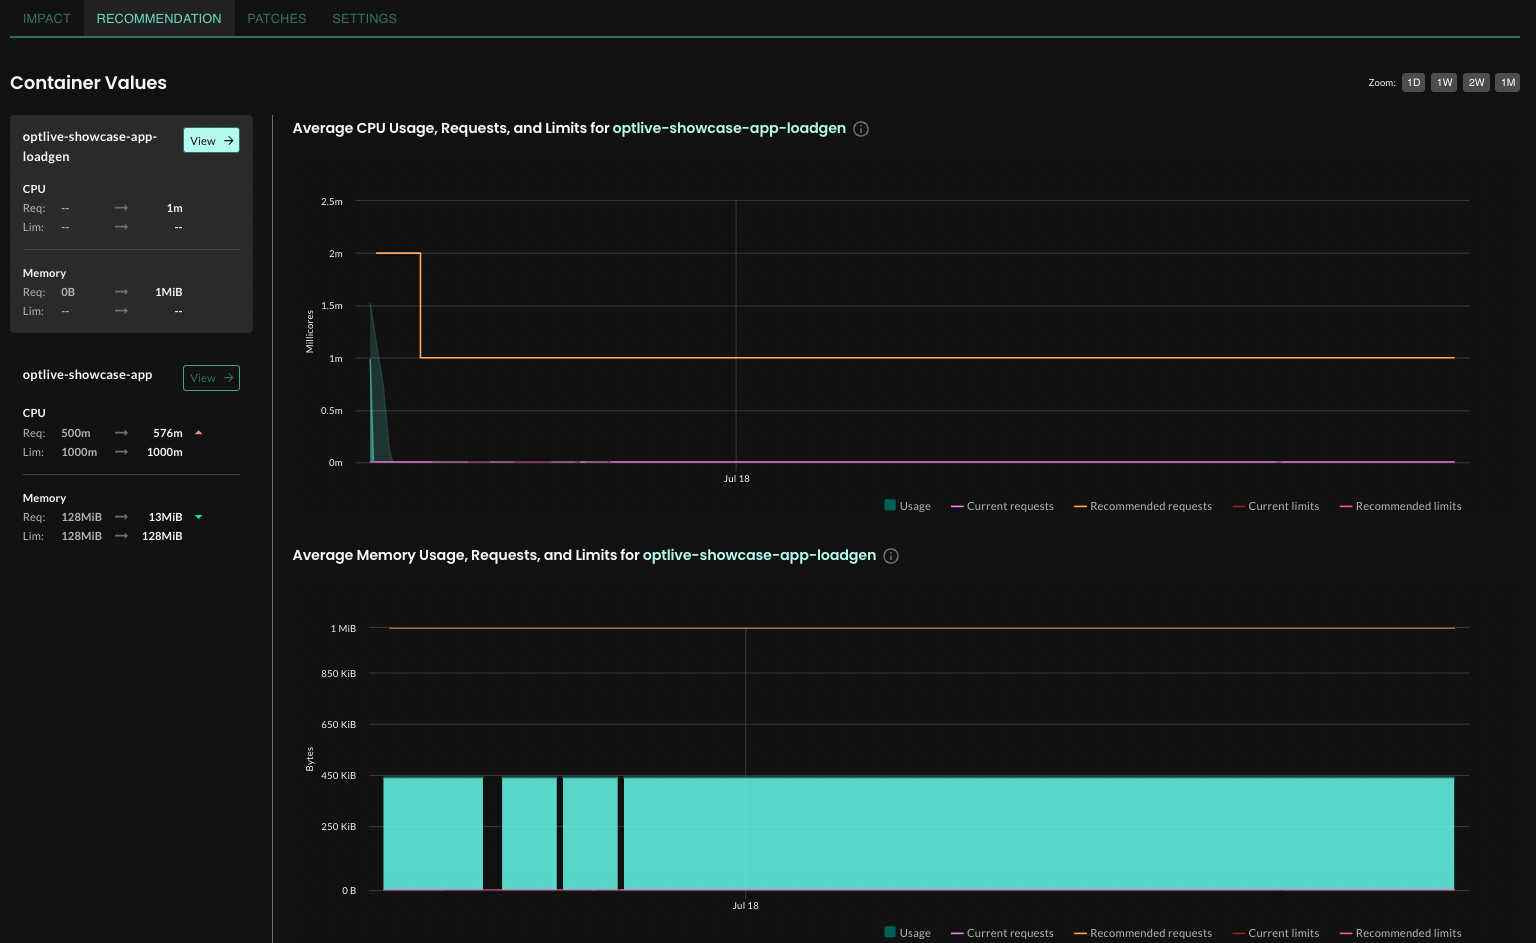
Agent version 2.12.2
Security
- Go upgraded from 1.22.4 to 1.22.5 to address CVE GO-2024-2963
- Addressed several CVEs related to the Prometheus container image (upgraded from 2.52.0 to 2.53.1)
Agent version 2.12.1
Added
- The strings
"Enabled"and"Disabled"are now accepted for thelive.stormforge.io/auto-deployannotation, in addition to the existing values ("true"and"false").
Changed
- HPAs owned by Flagger are now supported (
patchTargetis a KEDA ScaledObject). - If the HPA
patchTargetis not detected,patchTargetis set to the HPA itself.
Fixed
- HPA settings are no longer silently ignored when an HPA is owned by a ScaledObject other than KEDA.
- HPA objects with
.specchanges now update HPA values. - ReplicaSets that have 0 pods are now reported correctly.
UI enhancements
Changed
-
Get Started improvements
You no longer have to save the generated Yaml values file when you install.
Simply provide a cluster name, run the generatedhelm installcommand, and click Check Connection. -
Optimization settings improved layout
On a workload’s Config tab, settings are now read-only and grouped as shown in the image below. To change these settings, use annotations as shown in the examples provided.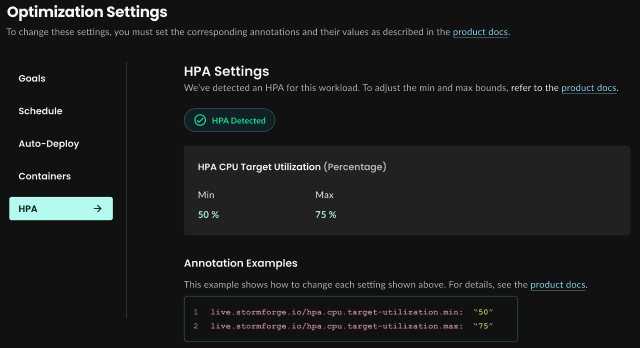
Agent version 2.11.0
Added
-
New default container optimization policy
We added aRequestsRaiseLimitsIfNeededcontainer optimization policy: Requests are always optimized; limits are optimized only if they already exist. If an existing limit is lower than what Optimize Live recommends, the limit is raised to Optimize Live’s recommended limit value.With this policy, limits are not lowered if they already exist, nor are they added if they don’t exist.
Note: The default optimization policy is still
RequestsOnly.Use the following annotation values (for details, see the product docs):
live.stormforge.io/containers.cpu.optimization-policy: "RequestsRaiseLimitsIfNeeded" live.stormforge.io/containers.memory.optimization-policy: "RequestsRaiseLimitsIfNeeded" -
PatchPath annotations
You can now use the following annotations to map a container resource value from a recommendation to where it belongs in thepatchTarget:live.stormforge.io/containers.memory.limits.patch-path live.stormforge.io/containers.memory.requests.patch-path live.stormforge.io/containers.cpu.limits.patch-path live.stormforge.io/containers.cpu.requests.patch-path
Fixed
- We fixed a condition that caused an Agent panic with ownerless pods on clusters running older versions of spark-operator.
Security
- Upgraded the Prometheus agent to version 2.52.0
Known conditions
- When setting requests and limits
patch-pathannotations along with theDoNotOptimizepolicy, you will see values on patchpath fields (previously the fields were set with a-). Regardless of the patchpath, the recommendations will respect the policy. The same is true for limitspatch-pathannotations when using theRequestsOnlypolicy.
Agent version 2.10.8
Fixed
- The StormForge Agent no longer crashes when it cannot find deleted custom resources from an installed package.
Agent version 2.10.7
Fixed
- We fixed the regex validation of hashed cron expressions (such as
"H H(0-5) * * *"), which are used to set recommendation schedules. For more schedule examples, see the Recommendation schedule topic in the product docs.
Agent version 2.10.6
Changed
- Updated
prometheusdependency to 0.53.0
Fixed
patchPathandpatchFormaton the WorkloadOptimizer CRD are now processed accordingly.- Updated example command lines on Helm README.
Applier version 2.4.0
Added
-
Continuous reconciliation
You can now configure the StormForge Applier to continuously reconcile drift, ensuring that the latest recommended settings are always maintained on a workload. See the new Helm configuration options below.-
reconciliation.mode:EventBased(default value) maintains the existing Applier behavior of patching workloads only when new recommendations are ready.Continuousenables continuous reconciliation. -
reconciliation.conflictingManagers: [value1,value2]: Used in conjunction withmode: Continuous. The Applier cannot reconcile the desired state for fields owned by conflicting managers.Use the following Helm values in a YAML file when you install or update the Applier:
reconciliation:
 mode: Continuous # default is `EventBased`

 # List the field managers that conflict with the Applier;
 # Fields managed by a conflicting field manager cannot be reconciled.
 conflictingManagers: []
-
Changed
- Updated stormforge-go to 3.9.2
- Updated go-application to 0.0.70
- Updated stormforge-agent to 2.10.5
- Updated controller-runtime to 0.17.3
- Updated oauth2 to 0.19.0
- Updated kubernetes api to 0.29.3
Agent version 2.10.5
Added
- Added network policies to ensure StormForge pods can communicate with each other now that the
workload-agentandprometheuscontainers have been separated into their own pods.
Changed
- Updated
controller-runtimeto 0.17.3 - Updated
kubernetesdependencies to 0.17.3 - Updated
stormforge-goto 3.9.2 - Updated
prometheusdependency to 0.51.3 - Updated
uber/zapto 1.27.0 - Updated
stretchr/testifyto 1.9.0 - Updated
kubernetesgroup to 0.29.4 - Updated
jackc/pgx/v5to 5.5.4 - Removed
kedacore2.13.0
Fixed
- We added code to ensure that the
cluster_namelabel in the ENV secrets file is the source of truth for the cluster name. - We fixed the problem of ReplicaSets being incorrectly created as workloads when owned by Argo rollouts.
- We fixed the bug that caused the
Failed to watch *v1.Secreterror, which occurred when the Agent requested access to secrets in order to parse certain KEDA ScaledObjects, depending on the configuration.
Security
- Updated Prometheus container image to v2.51.0
- Updated
go-jose/v3to 3.0.3
UI enhancements
Changed
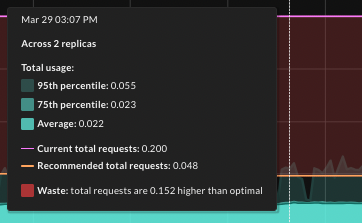
- Improved recommendation impact charts
-
Shading for Usage now includes the 95th and 75th percentile total usage in addition to average total usage.
-
Shading for Net impact more clearly explains the “gap” between current and recommended requests settings.
-
Chart tooltips on the Impact tab now include Waste (overprovisioning) or Performance risk (underprovisioning) details, as shown below.
-
UI enhancements
Added
-
Easier to understand recommendation impact information
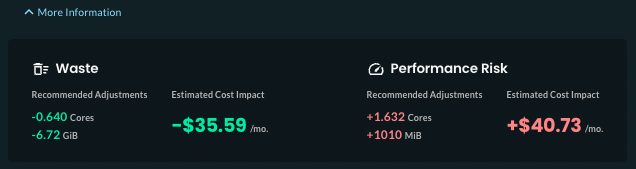
Redesigned page headers on the Overview, Cluster, and Namespace pages make it easier to understand projected savings at each level.The new Optimization Score measures how well the current request settings align with Optimize Live’s recommendations (100 indicates perfect alignment). This score replaces the Overall Efficiency score.
In the page header, click More Information to reveal the recommended CPU and memory adjustments and their estimated cost impact.
-
RBAC: View-only role now available
Administrators and managers can now assign users to a Viewer role. Viewers can export patches and have view-only access for recommendations, workload configurations, cost estimates, and cluster management information. By default, new users are assigned the Administrator role.In the left navigation, click Settings > Users. In the Actions column, click Set Role, and choose Viewer.
-
View and download workload and HPA patches
On the workload details page, click the View Patches tab. You can also copy the generatedkubectl patchcommand to apply the patch. -
Other UI improvements
- New or improved error messages for some scenarios.
- On the workload details page:
- The page header shows Kubernetes workload type (Deployment, Daemonset, and so on).
- Graphs on the Impact and Recommendation Details tabs now use a consistent date format (MMM DD).
- Autodeployment thresholds configured by the Agent are now shown on the Config tab.
Removed
- Cost Estimates page: Show/hide costs toggle
As part of the new page header design, dollar amounts are now always shown.
Applier version 2.3.0
Added
-
Continuously enforce the latest recommendation after workload updates
You can now configure Optimize Live to detect changes to workload requests or limits and then automatically reapply the latest recommendation. This ensures the workload remains optimized.By default, Optimize Live does not reapply recommendations after such changes.
To continuously enforce the latest recommendation, do one of the following when you install the Applier:
- In your Helm
values.yamlfile, setenforce: true. - In the
helm installcommand, include--set enforce=true.
- In your Helm
-
Define which CD tools’ changes do not trigger reapplying a recommendation
If you setenforcetotrueas described above, you can also define which continuous delivery tools’ changes (for example, changes by Argo CD, Flux) do not trigger reapplying a recommendation. If an exempt manager changes a workload’s requests or limits, Optimize Live will not reapply the latest recommendation.To define the list of exempt managers, do one of the following when you install the Applier:
- In your Helm
values.yamlfile, set theexemptManagerskey.
Example:exemptManagers: [value1,value2] - In the
helm installcommand, include--set exemptManagers={value1,value2}.
- In your Helm
Changed
- We increased the default health timeout from 5 minutes to 30 minutes. If pods don’t restart within 30 minutes after applying a recommendation, the recommendation is rolled back.
- Updated kubernetes to 1.29.x
- Updated controller-runtime to 0.17.2
- Updated gramLabs/go-application to 0.0.68
- Updated argo-rollouts to 1.6.5
- Updated zerolog to 1.32.0
- Updated oauth2 to 0.17.0
- Updated stormforge-go to 3.8.7
Security
- Updated go-jose to 4.0.1 to address DoS vulnerability
Agent version 2.10.4
Changed
- To improve performance, the
workload-agentandprometheuscontainers now run in their own pods.
Fixed
- We fixed a bug in how we reconcile workload annotations. You’ll now see your updated configurations in the UI.
- We removed
cluster_nameactual values from theprometheusConfigMap and now set the cluster name from the secret to prevent a cluster name mismatch. - We fixed the validation of CPU and memory optimization goals to allow capitalized values (
Savings,Balanced,Reliability).
Dependencies
- Prometheus agent upgraded to version 2.49.1
prometheus/commonupgraded to 0.47.0controller-runtimeupgraded to 0.17.1stormforge-goupgraded to 3.8.6- Kubernetes API dependencies upgraded to 0.29.2
Security
- The
workload-agentcontainer now addresses CVE-2020-8911 and CVE-2020-8912 with the upgrade ofprometheusGo module to version 0.49.1.
Agent version 2.10.3
Added
- Support for workloads with names that exceed 47 characters
Optimize Live can now optimize workloads that have names that exceed 47 characters. Previously for such workloads, Optimize Live showed this error:"No container metrics observed for this workload in the last 10 minutes."
Fixed
- Schedule annotations are now created consistently
We fixed a regression in which workloads with annotations were created without theschedulevalue.
Agent version 2.10.2
This release consists of internal improvements that build on version 2.10.1 of the Agent.
Agent version 2.10.1
Added
- Added HPA Helm parameters
To set cluster-level HPA target utilization defaults, you can now use the following Helm chart values:hpaCpuTargetUtilizationMin hpaCpuTargetUtilizationMax hpaMemoryTargetUtilizationMin hpaMemoryTargetUtilizationMax
Fixed
- HPA annotations released in version 2.10.0
The new HPA annotations added in 2.10.0 did not work as documented, and have been been fixed.
Security
- Upgraded
cloudflare/circlfrom version 1.3.3 to version 1.3.7 to address high-severity security issueCIRCL's Kyber: timing side-channel (kyberslash2) - Upgraded
golang.org/x/cryptoto v0.17.0
Agent version 2.10.0
Added
- Annotations for HPA CPU and memory target utilization
You can now configure HPA target utilization ranges (min and max values) for both CPU and memory by using the following annotations:live.stormforge.io/hpa.cpu.target-utilization.min live.stormforge.io/hpa.cpu.target-utilization.max live.stormforge.io/hpa.memory.target-utilization.min live.stormforge.io/hpa.memory.target-utilization.max
Deprecated
-
Pod template (PodTemplateSpec) annotations on workloads
We no longer support PodTemplateSpec (.metadata.spec.template.metadata.annotations) annotations for annotating workloads.Instead, workload-level annotations must now be added to the workload object directly in the
.metadata.annotationssection, as shown in this example:apiVersion: apps/v1 kind: Deployment metadata: name: example namespace: default annotations: live.stormforge.io/auto-deploy: "false" live.stormforge.io/containers.cpu.limits.limit-request-ratio: "1.3" ...
Security
- Upgraded go-application to version 0.0.64
- Upgraded Prometheus dependency to version 2.48.1 for security fixes
Applier version 2.2.0
Security
- Updated
golang net/httppackages to address CVE-2023-44487. - Updated
golang.org/x/cryptofrom version 0.14.0 to version 0.17.0. - Updated
go-applicationto version 0.0.64.
UI enhancements
-
New: Workloads Summary page
You can now view workload totals categorized by workload status, errors, and warnings.In the left navigation menu, click Workloads.
Agent version 2.9.1
Added
- Additional metrics scraping
Optimize Live now scrapes the following cAdvisor metrics:
container_cpu_cfs_throttled_seconds_total,container_memory_max_usage_bytesandcontainer_oom_events_total.
Agent version 2.9.0
Added
-
Support for setting deployment thresholds (via UI, CLU, annotations)
To help reduce pod churn, you can now define minimum change thresholds to prevent Optimize Live from automatically applying new recommendations.You can define a percent change, unit amount change, or both, by using the following methods:
- UI: On the Config tab of workload details page, as part of the Automatic Deployment setting.
- Annotations:
live.stormforge.io/auto-deploy.thresholds.*annotations. See the examples in the Auto-deploy topic. - CLI:
--auto-deploy-thresholds-min*arguments as part of thestormforge edit workloads handlercommand.
For details, see Auto-deploy thresholds in the Auto-deploy settings topic.
-
Changes to the default optimization policy and limit-to-request ratio
The default optimization policy is now RequestsOnly. Previously, it was RequestsAndLimits.When the optimization policy is set to RequestsAndLimits, the new default limit-to-request ratio is 2.0 (increased from 1.2). Optimize Live will not update containers using a 1.2 ratio to the new default 2.0 ratio. In the UI, a 1.2 limit-to-request ratio is now shown as Custom.
Security
- To address CVE-2023-44487, we upgraded grpc-go to version 1.56.3.
UI enhancements
UI enhancements when working with workloads:
-
Impact Overview graphs: Choose a time range
On the Impact tab of a workload details page, you can now zoom in or out to view different data points and the potential recommendation impact across different time intervals: 1 day, 1 week, 2 weeks, or 1 month.

-
Configure page: Enhanced validation of requests values
We now do more checks on the requests values that you enter. Most notably, we let you know if a CPU or memory value seems unexpectedly high or low.
Agent version 2.8.0
Added
-
Easy troubleshooting
You can now do a health check and get troubleshooting info (for example, if the Agent doesn’t install as expected) more easily by running:helm test stormforge-agent -n stormforge-system --logs -
UI: Add Cluster button now available on the Clusters page; improved cluster management workflow
You can now add clusters via the Optimize Live UI: In the left navigation, click Clusters, and on the Clusters page, click Add Cluster.Note: If you’re using the Optimize Live free trial license and want to add another cluster, click Add Cluster and on the next page that’s shown, click Add a cluster to my trial.
-
Annotations: Support for additional case types (optimization goals and policies only)
UpperCamelCase values align with Kubernetes conventions, but you also can use lowercase values.-
Valid values for the
live.stormforge.io/cpu.optimization-goalandlive.stormforge.io/memory.optimization-goalannotations:"Balanced"(default),"balanced","Reliability","reliability","Savings","savings" -
Valid values for the
live.stormforge.io/containers.cpu.optimization-policyandlive.stormforge.io/containers.memory.optimization-policyannotations:"RequestsAndLimits"(default),"requestsandlimits","RequestsOnly","requestsonly","DoNotOptimize","donotoptimize"
-
Changed
-
Helm parameter: Use
debuginstead ofworkload.debug
To enable or disable debug mode, use the--set debug=<VALUE>(trueorfalse) Helm argument. We have deprecatedworkload.debug. -
Helm
lookupfunction removed from workload initialization
We changed the workload initialization routine to ensure compliance with AWS EKS scans.
Fixed
- The namespace-level
auto-deploy=trueannotation now has precedence
This release fixes a bug that prevented the namespace-levellive.stormforge.io/auto-deploy=falseannotation from overriding the cluster-defaults ConfigMaplive.stormforge.io/auto-deploy=trueannotation.
Deprecated
- We deprecated the Helm
workload.debugparameter. Use--set debug=trueor--set debug=falseinstead.
Security
- To address CVE-2023-44487, we updated the Golang
net/httppackage versions.
Agent version 2.7.1
Added
-
Recommendations for workloads that scale down to 0 replicas
Optimize Live now provides recommendations for workloads that scale down to zero replicas for short periods of time within a 7-day period.-
If a workload is scaled down to 0 replicas for 25% of the time over 7 days, a recommendation is still provided, and you’ll see a warning in UI about the amount of time scaled down.
-
If a workload is at 0 replicas for more than 75% of the time over 7 days, no recommendation is provided, and you’ll see an error in the UI.
-
Fixed
-
Helm value
clusterDefaultConfig.schedulepermits day specifiers and commas
This release fixes a Helm validation error that prevented users from installing a cluster default schedule that included multiple weekdays or used day names (MON,TUE,WED and so on).Examples:
- As an argument in a
helm installcommand:
--set clusterDefaultConfig.schedule="H 20 * * WED,THU,FRI"
- As an argument in a
Agent version 2.7.0
Added
-
OpenShift support
You can now optimize workloads on clusters managed by OpenShift. When you install the StormForge Agent on a cluster, include the--set openshift=trueargument. For details, see Install on Red Hat OpenShift Container Platform in the product docs. -
Support for automatic rightsizing of workloads scaled by a KEDA-owned HPA
Optimize Live can now provide recommendations and patch workloads that have an HPA that is managed by KEDA. Previously, Optimize Live could only make recommendations for these workloads.
Applier version 2.1.0
Added
-
Improved patch rollback and workload health checks
The Applier now performs additional health checks to ensure that a workload is always in a healthy state before applying patches. If a patch fails, the Applier can now roll back all patches to reach the previous healthy state.We also improved the Applier logging, making it easier to understand what a patch is doing, patch application progress, and the health of a workload after applying patches.
-
Support for automatic rightsizing of workloads scaled by a KEDA-owned HPA
Although this is a new Agent (version 2.7.0) feature, you must grant the StormForge Applier additional RBAC permissions.
Agent version 2.6.0
Added
-
Optimize Live 30-day free trial
If you’re not already using Optimize Live, sign up at app.stormforge.io/signup and within minutes, you’ll have Optimize Live running on the Kubernetes cluster you specify.Need to see it to believe it? This 3-min Getting Started video walks you through setup (which takes less than 2 minutes) and gives you a quick overview of the insights you’ll get in just 1 hour after installation.
-
New StormForge Agent installation wizard
If you’re just starting out with Optimize Live, you can now install the StormForge Agent by using the Get Started wizard. Log in to app.stormforge.io with your StormForge login, and in the left navigation, click Overview. -
Recommendation schedules now support for Cron format
When you configure workloads using Kubernetes annotations, you can now set a schedule using Cron format. Previously, only macros and ISO 8601 Duration strings were supported.Examples:
-
Once daily (default value and best practice):
live.stormforge.io/schedule: "H H * * *" -
Every morning at approximately 0800h (exact time is not guaranteed):
live.stormforge.io/schedule: "00 08 * * *"
For details, see the Recommendation schedule topic.
-
Applier version 2.0.6
Changed
- Applier Helm chart updates
We updated the Applier’s Helm chart to use new Agent secret names and values. No action is required unless you have changed Agent secret values.
Agent version 2.5.1
Fixed
- We fixed an encoding problem with the manageAuthSecret feature released in version 2.5.0.
Agent version 2.5.0
Changed
- Helm installation:
--set stormforge.clusterName=CLUSTER_NAMEmust be changed to--set clusterName=CLUSTER_NAME. - We now consume the
prometheusimage from quay.io instead from Docker Hub. To fallback to Docker Hub, pass the following parameter as part of the Helm installation:--set prom.image.repository=prom/prometheus. - To manage or rotate authorization credentials outside of Helm, set the Helm value manageAuthSecret to
false. If you set this value tofalse, make sure that the stormforge-agent-auth secret exists before installing or upgrading.
Known Issues
- In certain environments, changing namespace-level StormForge annotations might not trigger reconciliation. For these scenarios, the annotations will be granted only on the following Agent restart.
Agent version 2.4.1
Fixed
- The controller no longer crashes when reconciling WorkloadOptimizer custom resources.
Agent version 2.4.0
Added
-
Support for setting default workload values at the cluster level
You can now use a configuration file or command line arguments as part of thehelm installcommand to set default values for all workloads in a cluster. See the examples below.Configuration file: Create a .yaml file and set the workload- and container-level values.
clusterDefaultConfig:
    schedule: P1D
    containersCpuRequestsMin: 100m,istio-proxy=50m
Command line arguments:
--set clusterDefaultConfig.schedule=P1D \ --set clusterDefaultConfig.containersCpuRequestsMin=100m,istio-proxy=50m -
Support for setting default workload values at the namespace level
You can now use annotations to set default workload values at the namespace level. Namespace-level values override cluster-level values.
Add the annotations to the
metadata.annotationssection of the namespace values file.apiVersion: v1 kind: Namespace metadata: annotations: live.stormforge.io/schedule: "P1D" live.stormforge.io/containers.cpu.requests.min: "100m,istio-proxy=50m" creationTimestamp: "2023-07-20T17:28:42Z" labels: kubernetes.io/metadata.name: kube-public name: kube-public resourceVersion: "9" uid: <UID> spec: ...
Changed
-
Updated the Helm installation to simplify proxy configuration
-
You can now add
--set proxyUrl=http://proxy.example.comto thehelm installcommand to specify a proxy server. -
The corresponding
no_proxyvariable is now seeded as follows with several RFC 1918 addresses:no_proxy:127.0.0.0/8,10.0.0.0/8,172.16.0.0/12,192.168.0.0/16If these seeded values meet your organizaton’s needs, you no longer have to create a separate proxy.yaml file as described in this advanced installation scenario in the product docs.
-
-
Updated the Helm installation to expose Prometheus scrape interval
In typical installations, you don’t need to change this interval — by default, the Prometheus scrapes for metrics every 15s.If StormForge Support requests that you change this interval, you can change it by adding
--set prom.scrapeInterval=INTERVALto thehelm installcommand, replacing INTERVAL with the suggested frequency.
Fixed
- We now handle workload updates more gracefully, correcting an issue that caused controller panic.
Applier version 2.0.5
This release contained internal enhancements only. No action is required.
Agent version 2.3.0
Added
-
Support for ingesting workload labels
By default, Optimize Live now ingests labels on Kubernetes workload objects, ensuring that StormForge workload labels match your workload labels, making it easier for you to search for workloads.To change this default behavior, setting
collectLabelstofalsein ahelm installorhelm upgradecommand:--set collectLabels=false -
Support for setting container default values by using annotations
You can now set default values for all containers in a workload by using annotations in pod objects.In the Pod template metadata (
spec.template.metadata.annotations) of a Deployment object, use the following syntax:live.stormforge.io/containers.CONTAINER_PARAMETER: "DEFAULT_VALUE"Example: To set
cpu.requests.minto20mfor all containers in a workload:
live.stormforge.io/containers.cpu.requests.min: “20m”To learn more about setting default values by using annotations, see the topics under Configure optimization settings.
Changed
- Prometheus agent version bumped to version 2.45 (Prometheus Long-Term Support release)
Applier version 2.0.4
-
Additional custom Prometheus metrics
You can now get more Applier performance details with the following Prometheus metrics:-
The following new metrics are vectored and have
workload_namespaceandworkload_resourcelabels:- sf_patches_processed_total
- sf_patches_failed_total
- sf_patches_rolled_back_total
- sf_patches_rollback_failures_total
-
The following new metric does not have the
workload_namespaceandworkload_resourcelabels - it applies only to the Applier, not a specific workload:- sf_applier_api_disconnections_total
-
Agent version 2.2.0
-
Workload garbage collection
We now do garbage collection (by default, every hour) to ensure that when workloads are removed from the cluster, they’re also removed from Optimize Live. To change this reconciliation interval, edit theworkload.workloadSyncIntervalin the workload’svalues.yamlfile. -
Regex support
We added regex support for the optional allowNamespaces and denyNamespaces parameters that you can provide when you install the StormForge agent.
Applier version 2.0.3
- Patch rollback support
We added rollback logic: If an error occurs when applying a patch for a recommendation, successful patches are rolled back.
Version 2.0
Be sure to check out our press release!
Added
-
New install method: Helm chart for stormforge-agent
You no longer need to download the StormForge CLI to install. Get up and running within minutes, and download the CLI later to run StormForge commands to manage your cluster. -
Optional Applier installation using a single Helm command
We separated the Agent and the Applier to simplify the permissions required at install.
If you plan to apply configurations on demand (outside of a regular schedule) or automatically outside of a CI/CD workflow, be sure to install the Applier component. -
Control workload metrics collection with allow and deny lists
By default, Optimize Live collects metrics on all the workloads in the cluster.
To restrict metrics collection to specific namespaces, you can provide a namespace allow list or deny list to when you install the agent. -
New UI workflows
Workload List View: See all workloads and the recommendations for those workloads, view cost estimates, and search against workload name, namespace, or cluster.
Workload Detail View: View the impact of the recommendations on the workload, drill into the recommendation details, and get container-specific details. Export or download the patch from the UI.
Removed
- In-cluster components
We no longer install the recommender or time-series database (TSDB).
Version 0.7.8
Fixed
-
Permissions issue during upgrade
This release fixes a permissions issue that sometimes caused the TSDB to crash when upgrading an existing Optimize Live installation.
Version 0.7.7
Added
-
All components now run as non-root
Individual components (TSDB, Applier, Recommender, Grafana) now run with
runAsNonRoot: trueset in theirPodSecurityContext. The Controller continues to run as non-root by default. This feature is helpful if you deploy Optimize Live in clusters that have security policies that require all containers to run as non-root. -
Improved handling of Datadog rate limit errors
The TSDB now gracefully handles HTTP 429 responses from the Datadog API. If Datadog is your metrics provider, you’ll see better performance when the Datadog rate limit is reached.
Version 0.7.6
Controller
Added
-
Support for DaemonSet optimization
Optimize Live can now optimize DaemonSets in workloads, resulting in even more resource savings.
Fixed
-
You can now specify any Grafana image or version
The Controller can now install Grafana using the image repository and tag that you specify in the Helm chart
values.yamlfile. Previously, the Controller installed the latest version of Grafana from the official registry only.In the
values.yamlfile, use this format:grafana: image: repository: docker.io/grafana/grafana pullPolicy: IfNotPresent tag: 8.2.0
Version 0.7.5
Recommender
Added
-
Support for workloads that scale based on custom metrics in the HorizontalPodAutoscaler
Optimize Live now produces a recommendation to size the workload to best align with the currently configured HorizontalPodAutoscaler custom metric. Previously, CPU utilization metrics were the only supported HorizontalPodAutoscaler metric.
Version 0.7.4
Recommender and Controller
Updated
-
Show recommendations even if some workloads in an application fail
Optimize Live now, by default, shows recommendations even if it couldn’t generate recommendations for all discovered workloads (for example, when workloads crash or fail, or when new workloads don’t yet have enough metrics data).
Previously, recommendations were shown only if they were computed for all discovered workloads. To preserve this behavior, set
FF_ONLY_COMPLETE_RECOMMENDATIONS=truein the extraEnvVars section of the Helm chart.
UI enhancements
-
Launch from the left navigation
Launch or switch between Optimize Live and Optimize Pro from the left navigation rather than from the tabs within an application. This update takes you to your applications and recommendations faster.
Version 0.7.3
Controller
Added
-
Deleting a Live object now deletes the corresponding application
When you delete a Live object from your cluster, Optimize Live now also deletes the application from the UI and the API. To restore the original behavior (in which the application isn’t deleted from the UI and API), label the Live object by running this command:
kubectl label -n stormforge-system live/my-applive.optimize.stormforge.io/skipSync=skip -
Grafana cleanup when uninstalling Optimize Live
When you uninstall Optimize Live, we now ensure all Grafana processes are also deleted.
TSDB
Fixed
-
Backfill duration of 0s now kicks off metrics collection
We now start collecting metrics when you configure the TSDB to skip backfilling (
TSDB_BACKFILL_DURATION=0s). In previous releases, this setting didn’t kick off metrics collection.
Version 0.7.2
TSDB
Added
-
Expose recommendation count, recommendation tx/timestamp metrics
The following optimize live metrics are available via
/metricsendpoint:optimize_live_recommendation_count, which displays a count of the most recent number of recommendations receivedoptimize_live_recommendation_timestamp, which displays a timestamp of when the last set of recommendations were madeoptimize_live_tsdb_series_timestamp, which displays a timestamp for each top level metric we ingest (limits,requests,usage, etc.)
Fixed
-
Limit Datadog query length when querying HPA metrics
We now ensure that queries sent via the Datadog API don’t exceed Datadog’s maximum query length of 8000 characters. Previously, this check was not in place when we added support for HPA recommendations.
Controller
Added
-
Support for pvc-less TSDB
You can now configure the TSDB to run without a PV/PVC by setting
TSDB_NO_PVC="true". Because this makes the TSDB data ephemeral, you should do it only in specific situations. TheTSDB_PVC_SIZEsetting can still be used to set a size limit when there is no PVC. -
Support for
limitRequestRatioconfiguration parameterYou can now configure how much headroom to add to the request recommendation for the limit. As the name suggests, this is a ratio between the limit and request. By default, this ratio is set to
1.2, which means that the limit recommendation is set to the requests recommendation plus 20%. -
Reducing the number of reconciliations via a feature flag
In large environments, you might choose to reduce the number of watches on the API server. To configure the controller to no longer watch components that it owns, set the
FF_NO_OWNSenvironment variable. When this is set, the controller no longer watches for events from the TSDB, recommender, or applier resources. -
Add
diffon tsdb and recommender ConfigMaps when debug mode is enabledWhen
DEBUGis enabled, you’ll see a diff of the tsdb and recommender ConfigMaps in the logs, making it easier to discover what was changed during a reconcile.
Fixed
-
Sort discovered HPAs
When multiple HPAs are configured for a target, we now sort this list to prevent unnecessary configuration churn.
-
One lookup for CPU and Memory targets
We now do one lookup for both CPU and memory targets. Previously we did separate lookups for CPU and Memory targets, which created situations where we would have unequal targets matched for CPU and Memory recommendations.
Misc
-
Change the log level to
errorwhen no targets foundFor easier troubleshooting, we now set the log level to
errorwhen no targets are found. Previously, because we would query again, we would log this at theinfolevel. -
Use
Intervalinstead of deprecatedUpdateIntervalWe now use
Intervalonly.
Version 0.7.1
Controller and Applier
Added
-
Support for reducing the resources used by a cluster
If you have many applications (for example, upwards of a couple hundred) and apply recommendations conservatively (for example, every few days), you can set
FF_PATCHER="true"in theextraEnvVarsection of your Helm chart. This consolidates and simplifies the cluster component stack and does not negatively affect cluster performance. -
Support for persisting patches to ConfigMaps
When you set
FF_PATCHER="true", you can now have the Controller write a patch to a ConfigMap by settingFF_PERSIST_PATCH="true". Writing a patch to a ConfigMap is useful for troubleshooting cluster resource use. -
Improved HPA logging
If no HPA targets are discovered, this information is now logged at the
infolevel. Previously, it was logged at theerrorlevel.
Workaround
-
No recommendations in an HPA setup
In some HPA setups, the Recommender might not discover HPA targets and therefore cannot generate recommendations. Sometimes this scenario occurs because the Kubernetes version and kube-state-metrics version are not compatible.
Workaround: Try downgrading your kube-state-metrics version.
Version 0.7.0
- Updated Helm chart value:
DEBUG=false, and setDEBUGto Boolean in thevaluesschema - Grafana updates simplify the information you see on dashboards
UI enhancements
On the Configure Recommendations page:
- In the Optional Settings section, you can now specify the CPU target utilization of the HPA recommendation.
- In the Advanced Settings section, you can choose either of the following:
- Enable Guaranteed Quality of Service.
- Exclude Memory Limits, CPU limits, or both from recommendations.
To access the Advanced Settings, contact your StormForge sales rep.
Version 0.6.0
- Added support for HPA constraints for min and max target CPU utilization
- Added support for collecting min and max replica metrics to provide better recommendations
Version 0.5.0 (HPA support)
Applier
Added
- Support for jsonpath custom patches
- Support for generating HPA patches
Controller
Added
- Support for bidimensional autoscaling
- Support for providing target utilization recommendations alongside CPU and memory
- Enabled HPA lookup by default
- Added recommendation labels to the dashboard to better filter results
Fixed
- We now correctly look up existing Live resources when syncing from the API
UI enhancements
- Added a progress bar that shows the progress of the TSDB backfill
- Added support for maximum CPU and memory limits
- Added a clusters list page
Version 0.4.0
Applier
Added
- Support for custom patches:
- You can now create a Live custom resource definition (CRD) to provision and configure a new Optimize Live instance
- You can now apply recommendations via a Live object
- Support for pods with multiple containers
- Support for arm64 architecture
- Updated Grafana dashboards:
- You can choose low, medium, or high risk tolerance for both CPU and memory when viewing recommendation summaries
- You can now see HPA-related data
- The Recommender now provides recommendations that honor the maximum limits that you specify
- You can now specify the following values in a Live object:
- Maximum bound for CPU and memory requests
- Minimum and maximum CPU and memory limits
TSDB
Added
- Significantly reduced TSDB ConfigMap size, allowing now up to 700+ targets per Live object (from previously only 100+ targets). For testing and troubleshooting, you can still add raw queries to the Controller’s configuration file, but you must add them manually.
Version 0.3.0
UI enhancements
- You can now set CPU and memory minimum limits when you configure recommendations
- Deleting an application in the UI now also deletes the application from the cluster
- A progress bar now displays data backfilling progress
- New search capability helps you to find your applications faster
Version 0.2.2
- Qualify Datadog metrics with cluster name
- Suppress log messages during backfill of data
- Fixed bug that could cause the recommender to stall
Version 0.2.1
- Added support for non-standard replicaset owners (e.g., rollouts)
- The Grafana dashboard has been updated to highlight the containers’ maximum usage
- The recommender now supports varying number of replicas
- The TSDB allows for customization of the persistent volume
- Added DEBUG log level for all the components
- The Controller supports proxies
- Beta support for Datadog as a metrics provider
Version 0.1.6
Optimize Live Launch
- Controller deploys the TSDB, the recommender, the applier and Grafana deployment
- Support for metrics stores in Prometheus