Try a sample application on your own cluster
9 minute read
The Showcase application is a sample application we developed to create load, enabling you to experiment with StormForge on your own cluster: generate, view, and apply recommendations, observe how our machine learning rightsizes workloads, and set values to generate recommendations based on your organizational needs.
This application creates a single Kubernetes Deployment (workload) that generates variable load using one CPU core for 24 hours. StormForge collects metrics on this workload and generates recommendations to rightsize it.
Two minutes after installing the Showcase application, you can see the initial metrics that StormForge has collected.
Ten minutes after installation, you’ll receive an initial recommendation—a collection of proposed optimized settings—and graphs that compare actual CPU and memory usage with the recommended settings. As StormForge collects more metrics, you can view the potential impact of recommendations and see the usage patterns on which StormForge bases its recommendations.
Prerequisites
You’ll need:
-
A StormForge account — sign up for a free 30-day trial
-
Helm version 3.14.0 or later
-
A Kubernetes cluster (from any Kubernetes distribution, such as EKS, AKS, minikube, or kind)
For minikube v1.38.0 or earlier, use
minikube start --container-runtime=containerdto setcontainerdas the runtime. From v1.39.0,containerdwill be the default runtime.
Check out the StormForge sandbox environment.
With view-only privileges, you can click through the StormForge UI, view recommendations, and view graphs that show usage, current requests, and recommended requests.
Install the Showcase application and StormForge (3min)
Install the Showcase application
From a command line, run:
helm install optlive-showcase-app oci://registry.stormforge.io/examples/optlive-showcase-app
Log in to StormForge
Go to app.stormforge.io and log in with your StormForge Account.
Install StormForge: Complete the steps in the Get Started wizard
- Give your cluster a name.
- Download or copy the generated Helm values file.
- Install StormForge: Copy and run the generated
helm installcommand. - Click Verify Installation and wait for this step to complete (it might take a minute).
Your cluster is now registered with StormForge.
Now that your cluster has a workload (the Showcase app) and StormForge installed, StormForge can start collecting metrics on the workload.
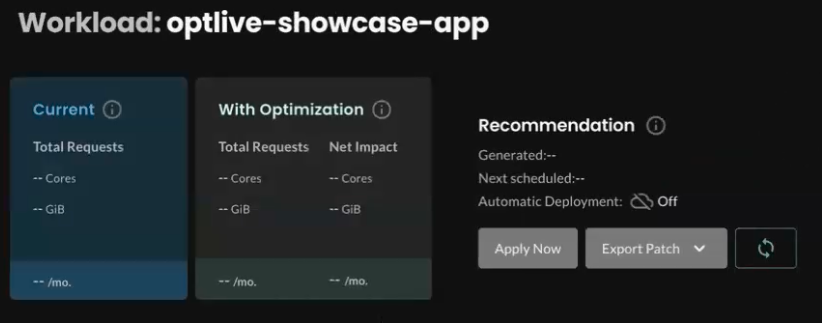
Within the first two minutes
StormForge has just started collecting metrics, so for a minute or two, the Overview and workload details pages look similar to this (we’ll go into detail in the next section):
What’s in a recommendation?
By default, a recommendation suggests optimized CPU and memory requests and limit values for each container in the workload. By default, only optimized request values are applied. You can change that to include limits, or you can exclude containers that don’t need to be optimized. Later in this guide, you’ll learn more about configuring optimization settings.
After 2 minutes: The view of your estate
StormForge has already identified overprovisioning and underprovisioning, and has estimated the potential savings that could be realized across the estate by applying recommendations.
The Overview page now looks something like this:
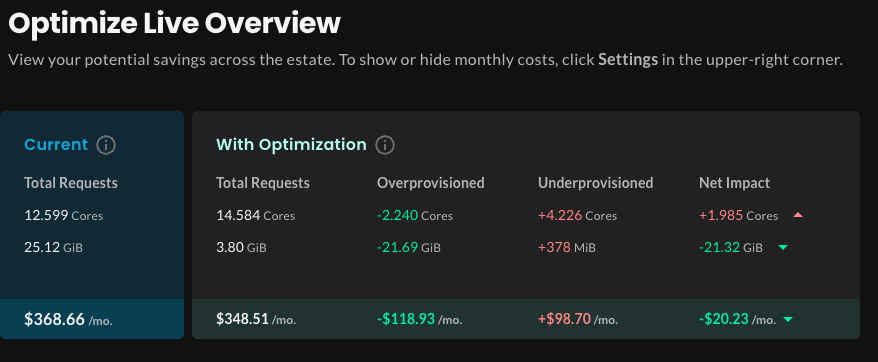
Notice the With Optimization section, which shows how the proposed values will rightsize workloads across the estate:
- Total requests is calculated by aggregating per-container recommended request values multiplied by observed replica count, and then averaging that value over the last 7 days.
- Net Impact shows the difference between current and recommended totals.
Let’s break down the numbers. At this point for this example—which reflects a tiny cluster—you’d realize a net savings of $20.23 a month by applying recommendations.
Let’s look at the math:
- Rightsizing overprovisioned workloads will potentially save you 2.240 cores.
- Rightsizing underprovisioned workloads will consume an additional 4.226 cores.
- Therefore, the net impact of rightsizing CPU resources is an additional 1.985 cores (4.226-2.240).
For memory resources:
- Rightsizing overprovisioned workloads will potentially save you 21.69 GiB, thus reducing costs.
- Rightsizing underprovisioned workloads will consume an additional 387 MiB.
- Therefore, the net impact of rightsizing memory requests is a savings of 21.32 GiB.
Where do the dollar amounts come from?
They’re calculated using the values on the Cost Estimates page. In the left navigation, click Settings > Cost Estimates. You can adjust them to better reflect your environment, and hide them if they’re not important to you.
Estate view: At-a-glance cluster, namespace, and workload health
Review the Top Clusters, Top Namespaces, and Top Overprovisioned/Underprovisioned Workloads sections to understand where applying recommendations is most beneficial.
Similar to the Net Impact column described previously, the Impact column shows the difference between the current requests and the proposed optimized requests.
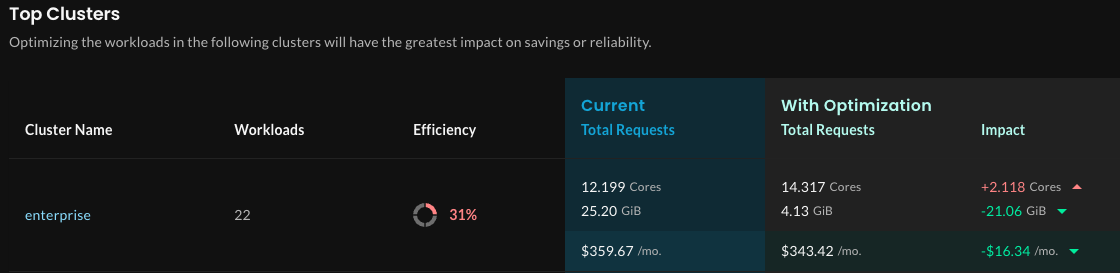
You can drill down to the workload level by clicking any item on the page.
After 10 minutes: Your first recommendation
About 10 minutes after installing the Agent, you’ll get a preliminary recommendation for rightsizing the Showcase application (the optlive-showcase-app workload). You can view the recommendation on the workload details page: In the left navigation, click Workloads and then find and click optlive-showcase-app. You’ll see something like this:
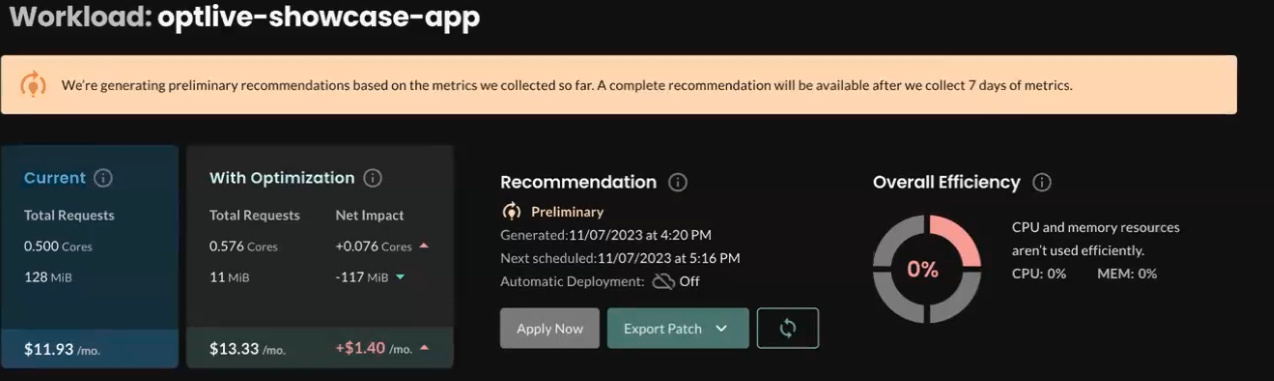
Notice the Net Impact column again, which shows the difference between the current and recommended request totals for CPU and memory. In this example, the recommendation proposes the following changes to rightsize the workload:
- Increase the CPU requests, which can help to reduce throttling
- Decrease the memory requests, which can help to reduce costs
This recommendation is based on the default “balanced” optimization goal. You can configure recommendations to be more aggressive for greater savings or less aggressive for greater reliability.
Impact shown as a graph
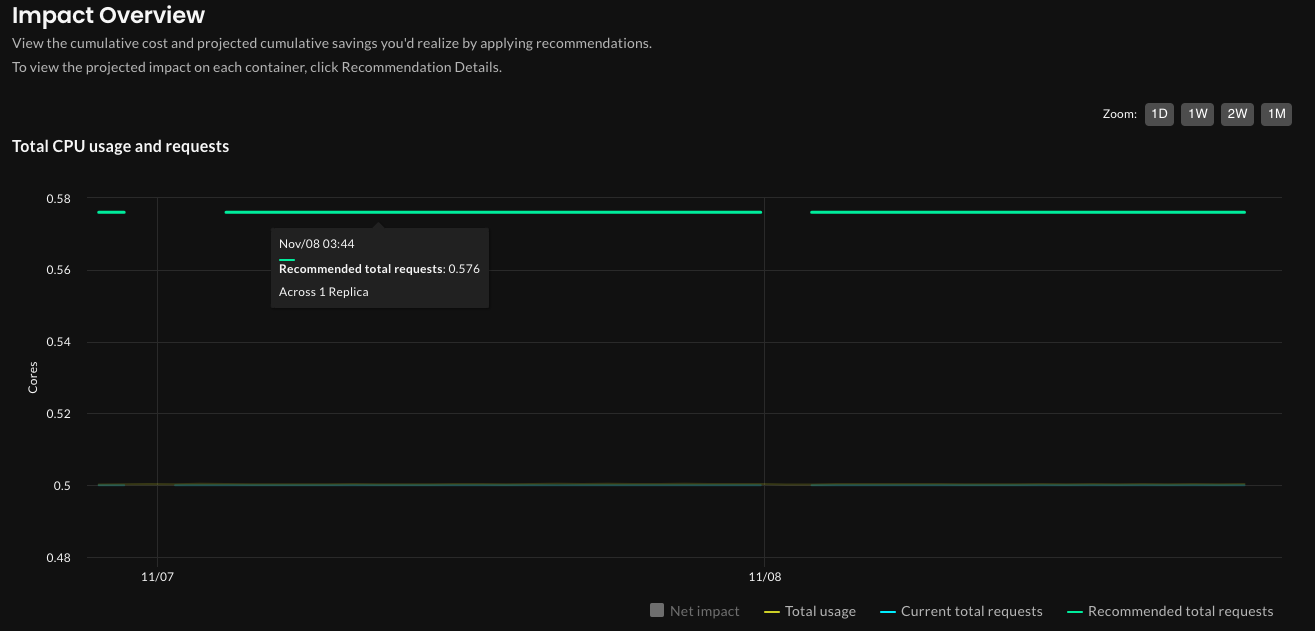
On the workload details page, click the Impact tab. The Impact Overview section shows time-series graphs of usage, current request settings, and the projected impact of applying recommendations on a workload, based on how that workload and its containers are configured (such as optimization goals, optimization policy, container-specific requests, and limits).
On the graph, hover to see details at a point in time. In the graph legend, select/deselect items to reduce visual clutter.
In this example, the current requests closely match actual usage, which suggests this workload might experience throttling. Notice that the recommended total requests line, drawn close to 0.58m, is consistent with the recommended Total Requests value (in the With Optimization section near the top of the page) of 0.576.
Same with total memory usage and requests: The current total requests line is much higher than the actual usage, so the recommended Total Requests value will help to rightsize this workload.
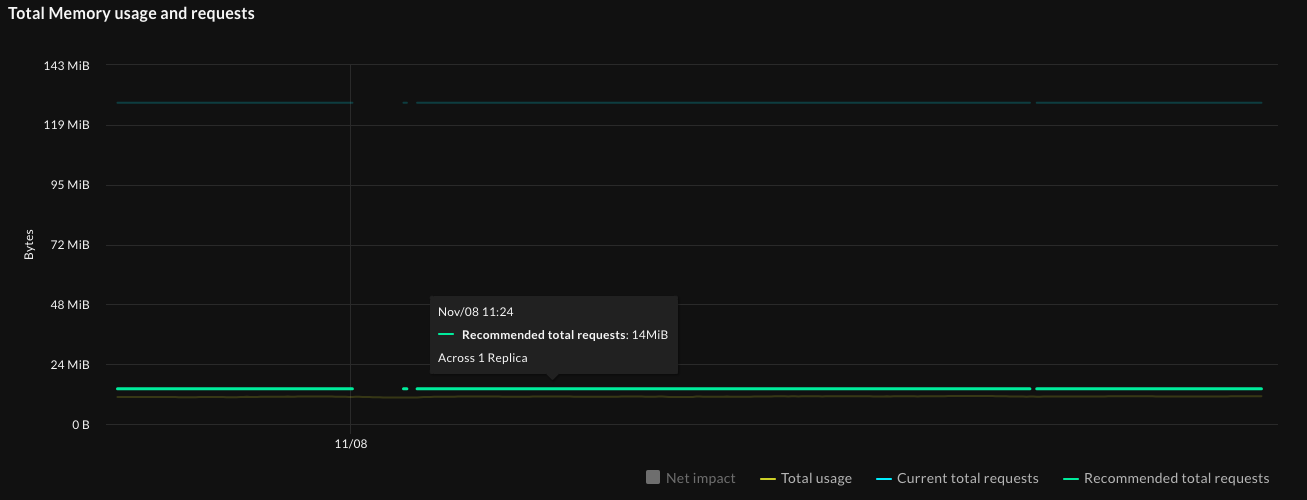
Based on the metrics collected so far for this workload, you can reduce throttling at a small cost.
Remember, this is for one small workload, after collecting metrics for only two minutes. If your estate has tens of thousands of workloads and many clusters, the impact of rightsizing could be much greater.
First 7 days: Metrics collection and preliminary recommendations
So far, you’ve looked at the first preliminary recommendation generated after one hour. Recommendations generated in the first 7 days are preliminary, and provide an evolving preview of the potential optimization impact. These can be viewed, but we recommend waiting for complete recommendations — available after 7 days — before applying.
After StormForge collects 7 days of metrics, you’ll receive a complete recommendation once daily (the default schedule). As a best practice, you should review and selectively apply the first few complete recommendations to see what happens. Then, as you trust recommendations more, you can enable them to be applied automatically on more workloads.
Even if you enable automatic deployment in this 7-day learning period, StormForge won’t deploy anything automatically until 7 days of metrics have been collected.
Key points so far:
- Rightsizing is more than just cost savings: It’s about making sure workloads run optimally.
- You’ll get the most out of StormForge when you let StormForge apply recommendations automatically.
Typically, reviewing cluster- and workload-level optimization details is sufficient. However, you can review container-level optimization details, for example, to troubleshoot traffic spikes or unusual workload behavior.
Read on to learn about the recommendation details for each container in a workload. Otherwise, you can jump to Configuring recommendations to learn about a few optimization settings that can refine your recommendations.
Reviewing container-level recommendations
On the workload details page, click the Recommendation tab to see the recommended requests and limits for each container. The selected row shows the current and recommended settings for the optlive-showcase-app container (which, by coincidence, has the same name as the workload):
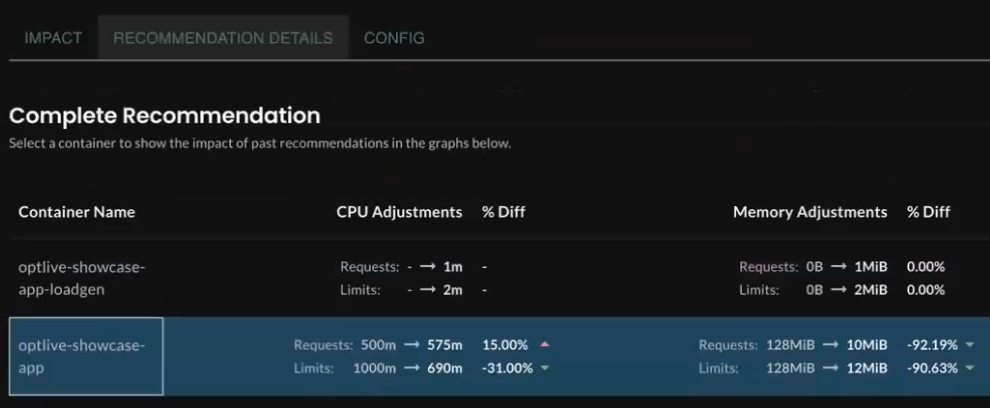
For this container, applying the recommendation would:
- Increase CPU requests value from 500m to 575m (an increase of 15%, to address underprovisioning).
- Lower the CPU limits value from 1000m to 690m (a savings of 31%, to address overprovisioning).
- Lower the memory requests value from 128MiB to 10Mib (a 92.19% decrease, to address overprovisioning).
- Lower the memory limits value from 128MiB to 12MiB (a 90.63% decrease, to address overprovisioning).
And if you look at the average usage graphs, for example, this graph of the optlive-showcase-app container shows the projected impact of using recommended settings, averaged across the time period shown on the graph.
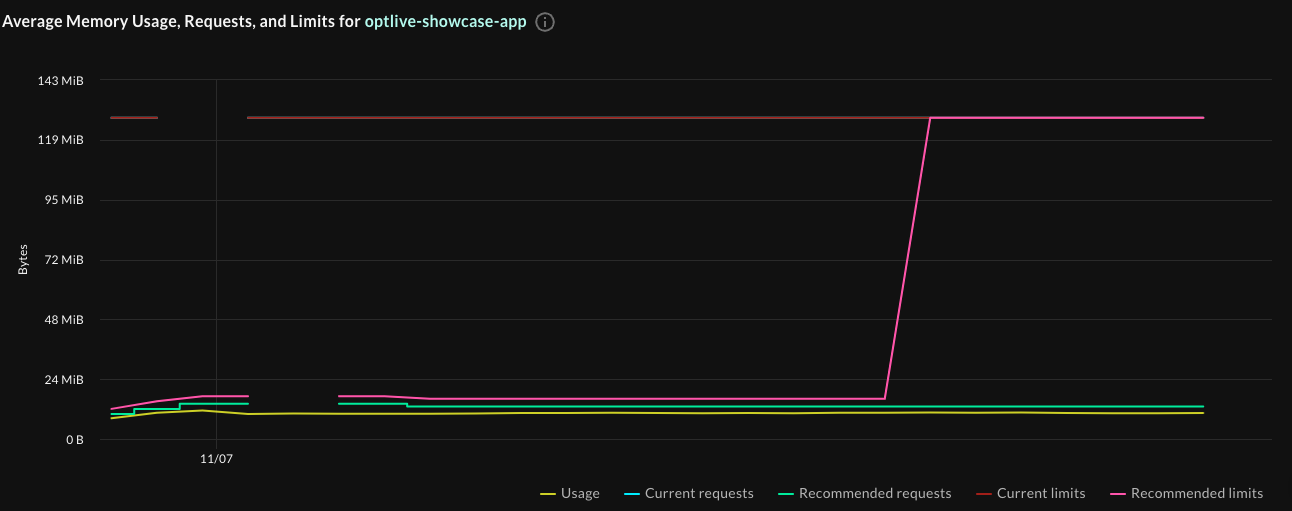
This graph makes a compelling case for having StormForge automatically apply recommendations.
Deploying recommendations automatically
The StormForge Applier is installed as part of StormForge and is ready to apply recommendations automatically.
When you’re comfortable with the recommendations StormForge generates, enable automatic deployment to keep resource settings current without manual review:
- Enable automatic deployment by setting the
live.stormforge.io/auto-deployannotation to"Enabled"as described in the Auto-deploy topic.
By default, a new recommendation is applied once daily. You can change the recommendation schedule based on how closely you want to track CPU and memory utilization and your tolerance for pod churn.
To reduce pod churn, you can define deployment thresholds to ensure that only the most impactful recommendations are applied.
Configuring recommendations
You can optionally configure several settings, including:
- Recommendation schedule: This defines how often StormForge generates (and optionally applies) recommendations.
- Optimization goals for CPU and memory: Do you want more “aggressive” recommendations that optimize cost savings, less aggressive recommendations that ensure reliability, or a balance of the two?
- Optimization policy: For each container, you can choose what to optimize: requests only, requests and limits, or neither.
- HPA target utilization: You can set this when an HPA is detected.
- Container-level thresholds: As mentioned above, thresholds specify the smallest amount of change to requests that makes it worthwhile to deploy new recommendations.
You can configure these settings by using the following methods:
- Annotations: Configure workloads individually, or at the namespace and cluster levels.
For details about configuring cluster, namespace, and workload defaults, as well as descriptions of the available optimization settings, see the topics under Configure optimization settings.
Recap
You installed the Showcase application to generate load on your cluster, and StormForge to generate recommendations.
Then you observed StormForge generated a preliminary recommendation and explored the details at the workload and container levels.
By letting the machine learning in StormForge rightsize workloads across your estate, you’ll see fast time to value and remove the toil of thinking about—and setting—optimal Kubernetes request values.