Debugging Test Cases
5 minute read
We aim to provide detailed error messages while developing a Test Case but there are still situations in which one wants to take a closer look.
curl Requests
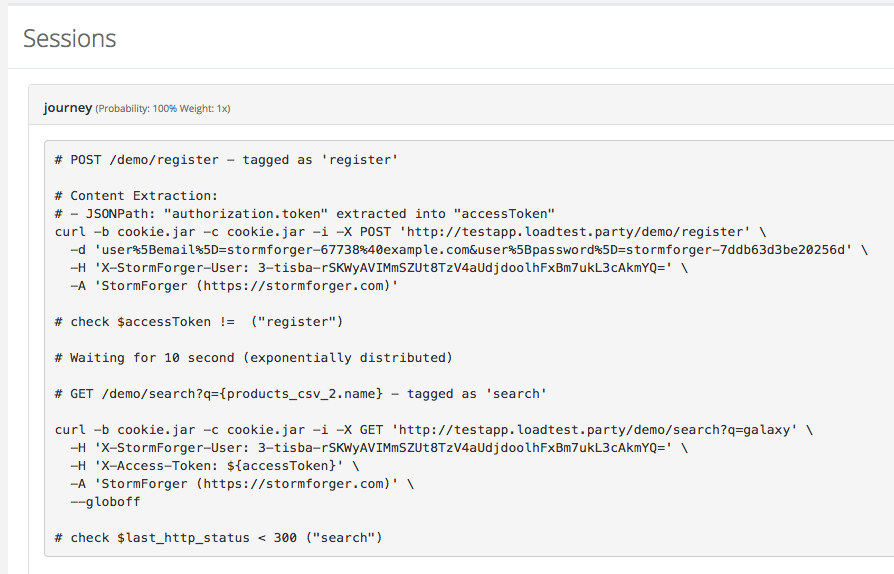
StormForge Performance Testing generates curl examples from your defined sessions to give you an idea what will be executed during the test run.
While the actual test case execution happens in a more complex environment we offer a translation of all HTTP requests to a list of copy-paste curl-commands for debugging and introspection purposes.
- After saving or updating a test case you will be redirected to the test case detail page.
- Below the test case summary you will find a box labeled
Sessionswhich lists all your defined sessions. - Click on the session of interest and the session will expand presenting you all defined requests of the session as CURL requests.
- You can now just copy and paste them into your terminal.

Test Case Validation
To verify that your Test Case logic behaves as expected you can validate your Test Case by launching a Validation Run:

Note
A Validation Run ignores the Arrival Phase configuration, starts one client per session, enables Traffic Dumping and works with limited resources.Alternatively you can pass --validate when launching a test-run using either the stormforge CLI or forge CLI.
You could now inspect the Target of your Test e.g. by reading through log files, or inspect the load generators Traffic Dump to verify that the Test Case properly fulfilled its job.
Or maybe you start adding Checks and Assertions which helps you to declare criteria that determine if your Validation Run was successful.
Checks and Assertions
You can also use checks and assertions to help you with identifying issues early on. Check out our guide on how to use checks and assertions.
Let’s say you want to operate on items in your shop’s basket. But you only can do that, if products have previously been added to the cart. You can use a check to see if you are set up properly:
session.get("/api/basket", {
  extraction: {
    jsonpath: {
      "item_count": "basket.item_count",
    }
  },
});

session.check("products_present", session.getVar("item_count"), ">", 0);
If you run a preflight test and see KOs for products_present you know that there seems to be an issue.
This is particular useful to figure out why there are so so many errors happening later in the session - they might simply be consequential errors.
Call Log
Please note:
The CLI usage described in this section is specific to the Standalone StormForge Performance Testing environment and CLI. This will be added to the unifiedstormforge CLI soon.
You can always access the call log via the web frontend.
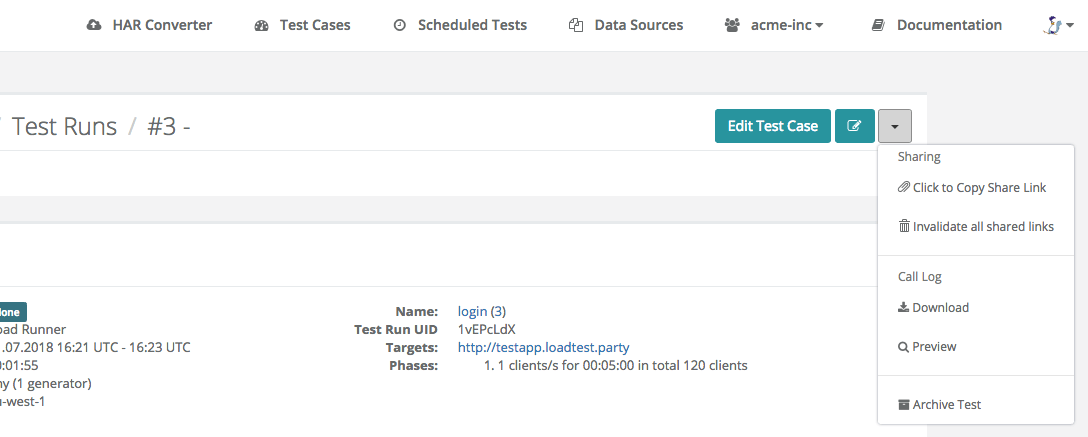
To further inspect what your test run did in more detail, you can access a so called “call log”. A call log is basically an access log containing basic information about requests that your test did perform. You can access the call log via the context menus of a test run report:

The call log consists of the following eight fields:
- unix timestamp of when the response was fully received
- HTTP method used for this request (GET, POST, etc.)
- host the request was sent to
- path and query parts of the request
- HTTP status code
- response size in Bytes
- request duration (from start to finish) in milliseconds
- tag used for this request
The call log is also available via our forge CLI using the forge test-run logs command:
$ forge test-run logs acme-inc/login/3
1530462072.428892;post;testapp.loadtest.party;/login?status=200;200;452;140.670;login
1530462072.975099;post;testapp.loadtest.party;/login?status=400;400;470;54.958;login
1530462073.703193;post;testapp.loadtest.party;/login?status=200;200;452;57.093;login
1530462074.046506;post;testapp.loadtest.party;/login?status=200;200;452;55.411;login
…
This will print out a preview of the first few thousand requests.
To download the full call log, use the --full flag (maybe in conjunction with --file <file> to redirect the output to a file).
Custom Log Messages
Note
This feature should only be used when developing or debugging test cases. It can easily overwhelm the cluster.The session object also supports custom log messages via the session.log(scalar) function.
These log messages are available in the ‘View Logs’ context menu of test run page.
Debugging Variables
The function session.dumpVars() helper prints all known variables of the current session into the log file (see Custom Log Messages).
Traffic Dump
Traffic is recorded automatically during a validation test run for analysis and debugging cases. Enabling Session Validation Mode runs only one user for each defined session. Thus the requests and responses in the traffic dump are in order for each session.
To access the trafficdump from your browser, navigate to the testrun report and use the “Download” link in the Summary:

Alternatively you can use the forge CLI:
Please note:
The CLI usage described in this section is specific to the Standalone StormForge Performance Testing environment and CLI. This will be added to the unifiedstormforge CLI soon.
You can always access the traffic dump via the web frontend.
To access the dump, use the test-run dump subcommand:
$ forge test-run dump aBcDeF89
Now test-case dump will download the traffic dump and prints it to stdout:
====== cid=8 rid=sf-qMRQDj0n-mwcJl6aHjtNJ time=2020-03-31T11:29:28+02:00 target=5.9.14.81:80
POST /test/login HTTP/1.1
Host: testapp.loadtest.party
Accept-Encoding: identity
Content-Type: application/x-www-form-urlencoded
User-Agent: StormForger-X/0.0.0-dev (+https://stormforger.com)
X-Request-Id: sf-qMRQDj0n-mwcJl6aHjtNJ

user=admin&password=letmein

HTTP/1.1 200 OK
Content-Length: 8
Connection: keep-alive
Content-Type: text/plain
Date: Tue, 31 Mar 2020 09:29:28 GMT
Server: nginx/1.15.9 (Ubuntu)

Welcome!
The format consists of all request/response pairs in sequential order.
Each pair is prefixed by a header (=====) with the following metadata:
cid- the client idrid- the request id - also available in the request headerstime- timestamp of the request (RFC3339)target- destination address that was used for this request