Try our Optimize Live sandbox
If you don’t have a cluster of your own, you can check out Optimize Live running in a view-only sandbox.
The sandbox contains two clusters, each running the same simulated e-commerce application.
This guide walks you through a comparison of optimized and non-optimized workloads, showing you how Optimize Live machine learning rightsizes your workloads based on the metrics it collects.
Log in to the sandbox
To preview Optimize Live (with view-only privileges) without having to install anything, go to the sandbox landing page.
Applications in the sandbox
Each cluster is running a simulated e-commerce application that has several workloads. One Kubernetes workload is running for each service (shopping cart, ad service, and so on).
The StormForge Optimize Live Agent is installed on both clusters. All workloads in this estate are configured to have a recommendation generated once daily.
- In the
dev-us-west2-optimizedcluster, recommendations are applied automatically as soon as they’re generated. - In the
dev-us-east1-not-optimizedcluster, recommendations are generated but not applied.
Let’s start with the Overview page.
- Note: The sandbox is a live environment, and its data is always changing. Therefore, the data in the sandbox won’t match what you see in this guide because this guide captures a point in time. Although the data differs, the principles are still the same.
Get the estate-level overview
The Overview page shows an estate-level summary similar to the following:
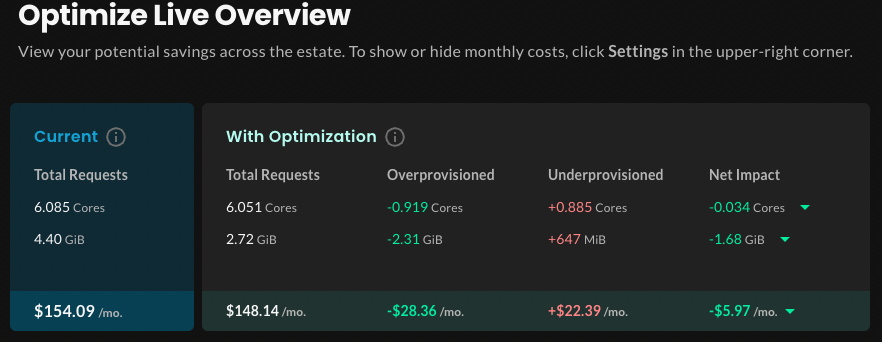
- The Optimization Score measures how well your current request settings align with Optimize Live’s recommendations. A score of 100 indicates perfect alignment.
- The Recommendation Summary section shows the current and proposed rightsizing values for workloads across the estate (in this scenario, two clusters):
- In the Recommended column, the requests value is calculated by aggregating per-container recommended request values multiplied by observed replica count, and averaging over the last 7 days.
- The Recommendation Impact shows the difference between current and recommended totals.
Let’s break down the numbers.
At this point in time in the sandbox, across both clusters, you’d realize a net savings of $73.17 a month by rightsizing your workloads with the recommended settings. That might not sound like much, but imagine an estate with many thousands of workloads.
Let’s look at the math for CPU resources:
- Rightsizing overprovisioned workloads will potentially save you 2.720 cores.
- Rightsizing underprovisioned workloads will consume an additional 0.181 cores.
- Therefore, the net impact of rightsizing CPU resources is an additional 2.539 cores (2.720-0.181).
For memory resources:
- Rightsizing overprovisioned workloads will potentially save you 5.65 GiB, thus reducing costs.
- Rightsizing underprovisioned workloads will consume an additional 962 MiB.
- Therefore, the net impact of rightsizing memory requests is a savings of 4.71 GiB (approximately 5.65-.962).
Where do the dollar amounts come from?
They’re calculated using the values on the Cost Estimates page. In the left navigation, click Settings > Cost Estimates. You can change them to be more reflective of your environment, or you can hide them if they’re not important to you.
Estate view: At-a-glance cluster, namespace, and workload health
The Top Clusters, Top Namespaces, and Top Overprovisioned/Underprovisioned Workloads sections help you to understand where you’ll get the greatest benefit from applying recommendations.
Typically, you’ll just scan these sections to decide where you need to investigate further, perhaps due to traffic spikes, deployment of new applications, or if total requests somewhere are higher or lower than expected.
From the Overview page, you can either:
- Drill down to the next level of detail by clicking an item. Each section lists up to 10 items.
- Skip directly to an item type by using the left navigation.
This guide walks you through each page section so that when you start using Optimize Live in your environment, you’ll know where to go based on what you want to see.
Let’s start by looking at the Top Clusters section.
The Net Impact column at the right shows the difference between the current requests and proposed optimized requests.
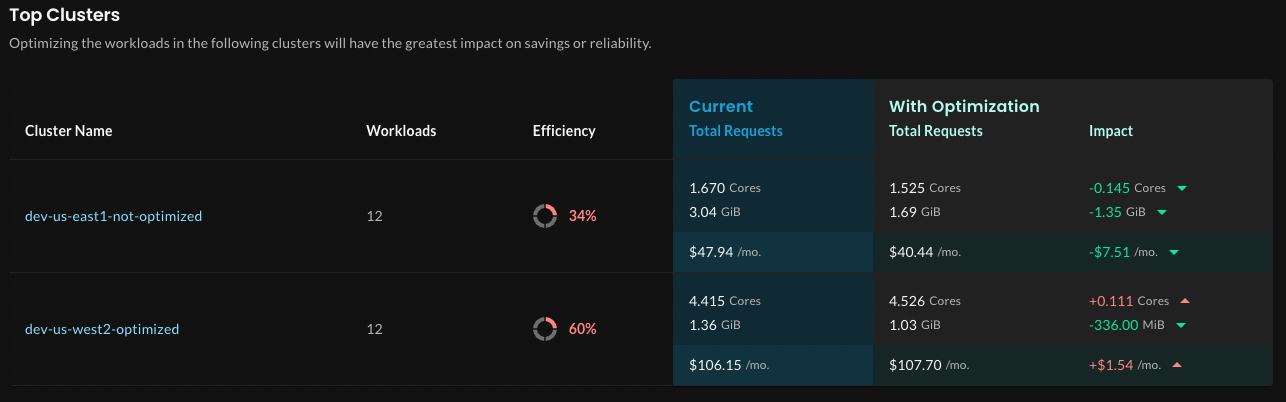
Notice how the dev-us-east1-not-optimized cluster is listed first: Its overall optimization score is much lower (30%), and the difference between current total requests and optimized total requests is greater than the dev-us-west2-optimized cluster. Optimizing the workloads in this cluster will have the greatest impact on savings.
In a real scenario, you might not know why there’s a difference between current and optimized total requests. If the cluster view is too high-level, you can either click into a cluster or scan the other sections of this page for more information.
Let’s see what the Top Namespaces section tells you.
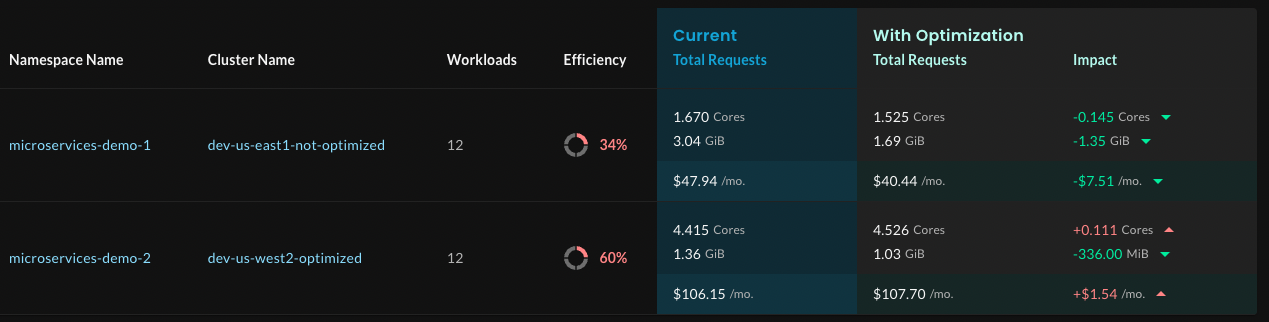
In this example, each cluster has just one namespace, so the total requests and impact values are the same as those in the Top Clusters section.
In a large estate, if several namespaces from the same cluster were listed, you might investigate those namespaces. Or, you could scroll to the Top Overprovisioned Workloads and Top Underprovisioned Workloads sections to assess what’s happening. Let’s take a look at the Top Overprovisioned workloads.
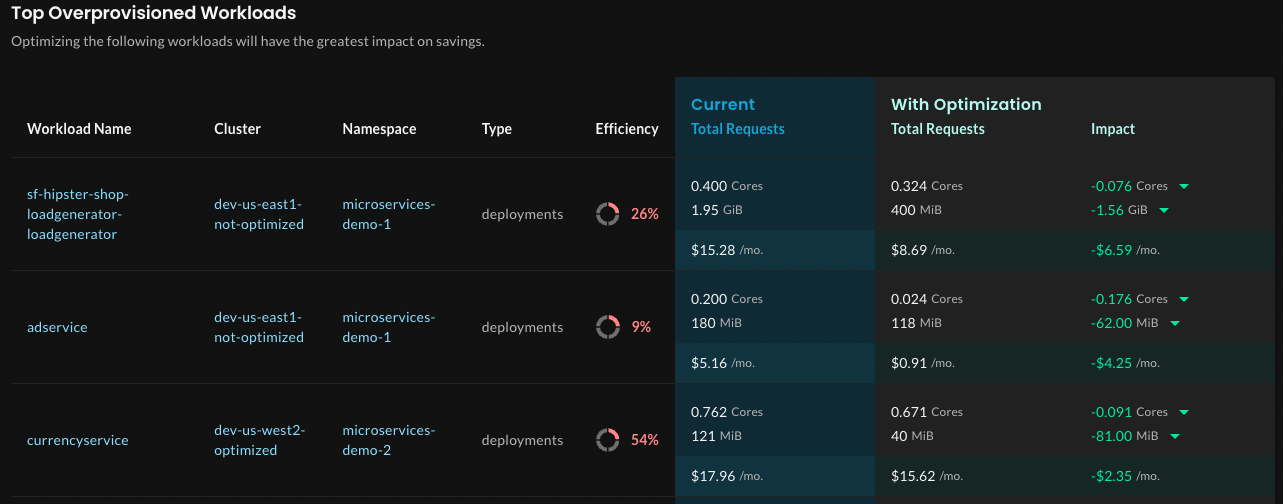 Notice that the two most overprovisioned workloads are in the
 microservices-demo-1 namespace, where you already know workloads are not applied.
Again, the Net Impact column in each row shows the difference between the current requests and proposed optimized requests, this time for the specific workload.
Click the sf-hipster-shop-loadgenerator-loadgenerator workload to view its details.
Notice the page header:
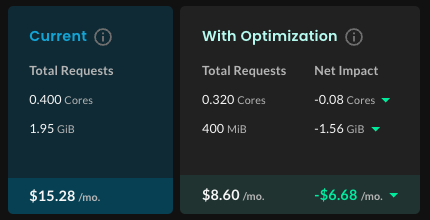
- The Net Impact column shows the difference between the current and optimized total requests, and the estimated cost savings.
- You already know that recommendations aren’t applied: In the Recommendation section, Automatic Deployment is Off. Recommendations are generated once daily, but not applied.
View how recommendations perform over time
Now let’s look at the how the recommendations would perform over time, which is shown on the Impact Overview graphs (on the Impact tab). Starting with the Total CPU usage and requests graph:
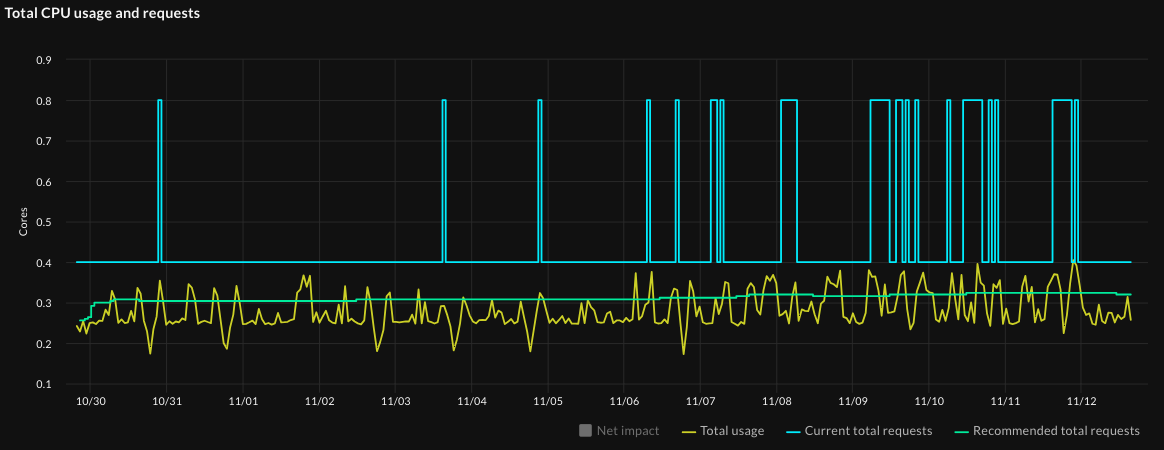
Notice the how much higher the current total requests (the purple line) are compared to the actual usage (the bright green shaded section) and the recommended total requests (the orange line). The red section shows wasted resources. This workload is overprovisioned with respect to CPU resources, and applying recommendations would rightsize it.
- Tip: To show and hide lines on the graph, click its name in the graph legend. For example, you might deselect Waste to reduce visual clutter.
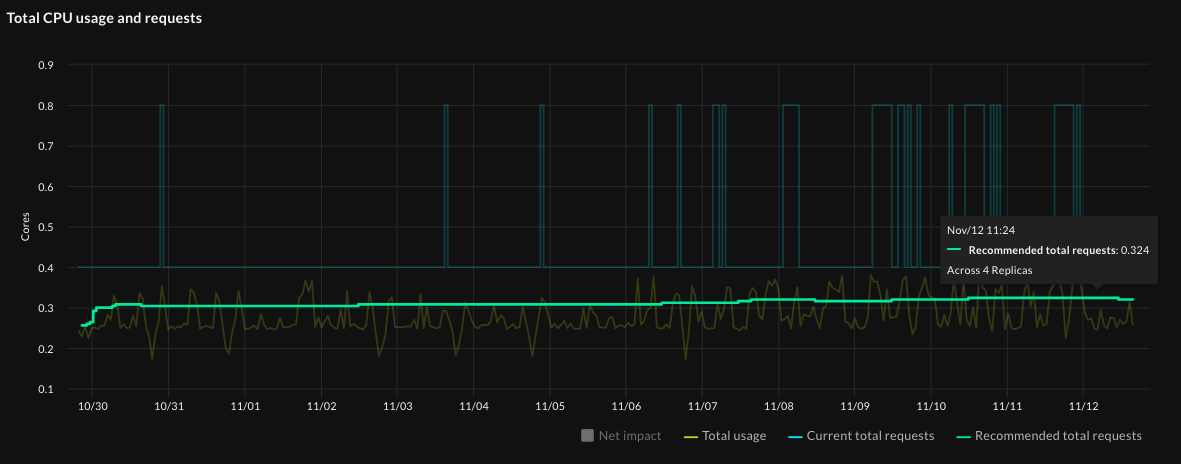
Now hover on the graph at a point in time when the recommendation was valid. Notice that the recommended requests value (0.212) at that time is close to the value shown in the workload’s Recommendation Summary (0.212 cores) at the top of the workload page:
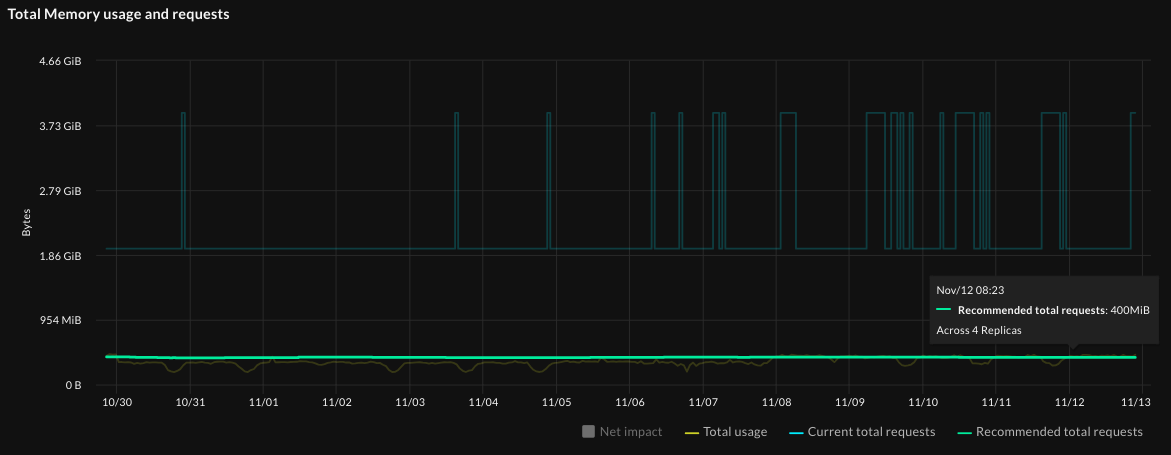
Similarly, with total memory usage and requests, the current requests are much higher than total usage, and the recommended requests are much closer to the actual usage. Applying recommendations will rightsize this workload.
Now let’s look at a container in this workload.
Reviewing the recommendation details: container-level recommendations
Before we look at the recommendation details and the container’s usage graphs, let’s look at how this workload and container are configured. On the workload details page, click the Settings tab, and in the Containers section, review the main container:
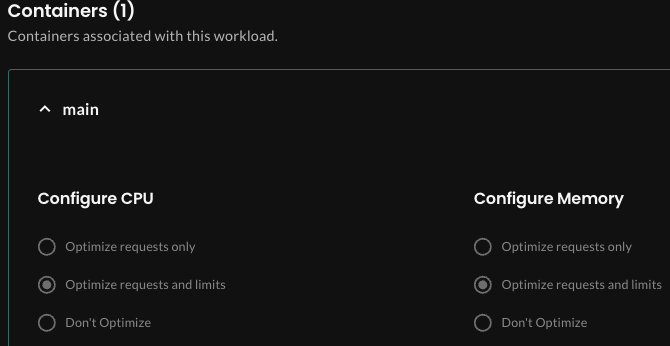
Remember, a recommendation includes the proposed optimized requests and limits values for each container in a workload. But the optimization policy for the container defines what is applied: requests only, requests and limits, or nothing.
- Note: If an HPA is present and scales on one resource metric (CPU or memory), the recommendation includes a target HPA value in order to preserve the scaling behavior after rightsizing the workload. In this example, no HPA is present.
In this example, if recommendations were to be applied, they would adjust both the requests and limits values for the container.
Go to the Recommendation tab, which shows the current and proposed requests and limits values for each container. Optimize Live recommends the following adjustments:
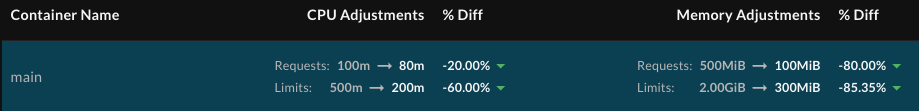
- CPU: Reduce requests to 53m and reduce limits to 200m (which is the lower bound for this container)
- Memory: Reduce requests to 59MiB and reduce requests to 177MiB
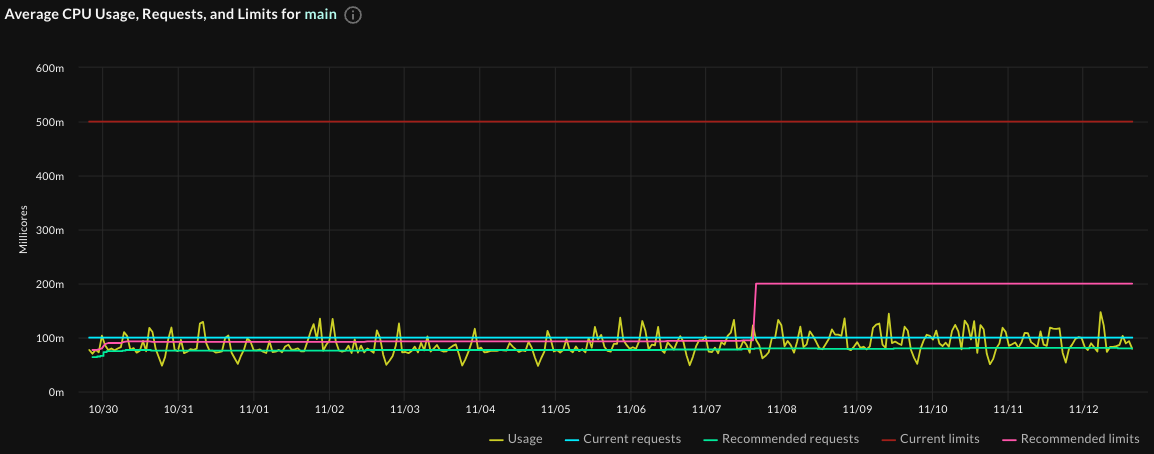
View recommendation performance at the container level
The container-level graphs show the overprovisioning clearly:
- In the Average CPU Usage graph, notice how much closer the recommended requests and limits (the orange and pink lines) are to the actual usage than the current requests and limits (the purple and red lines):
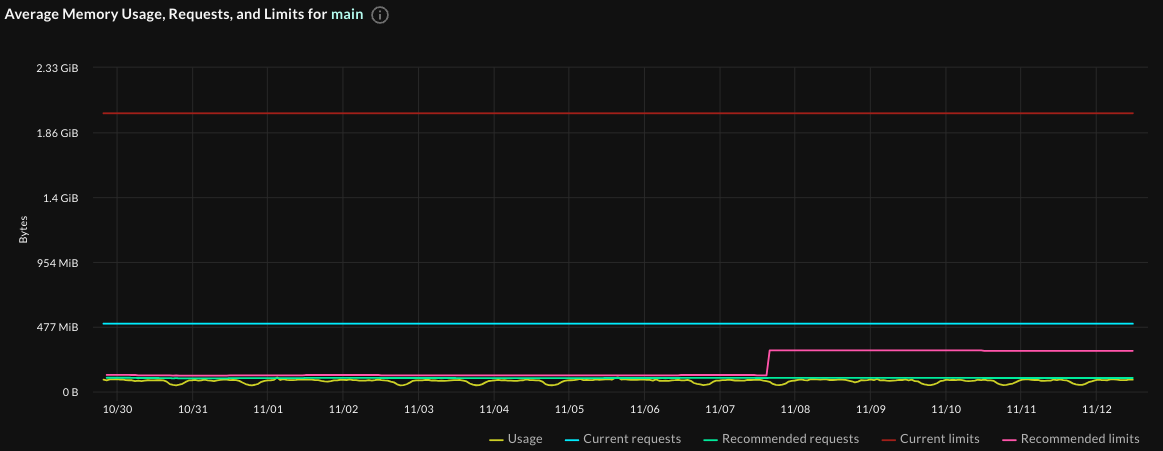
Notice the same in the Average Memory Usage graph:
Going back to the Average CPU usage graph (because it’s more dynamic than the memory graph), when you hover over a point during which this recommendation was valid, you see that the recommended settings in the graph match the most recent recommendation settings - look at the recommended requests:

The potential rightsizing you see in the graphs should make a compelling argument for enabling recommendations on this workload.
Deploying recommendations automatically
When you’re comfortable with the recommendations that Optimize Live generates, you can let Optimize Live deploy them automatically to save you time and toil:
- Install the Optimize Live Applier.
helm install stormforge-applier \ oci://registry.stormforge.io/library/stormforge-applier \ -n stormforge-system - Enable automatic deployment by setting the
live.stormforge.io/auto-deployannotation to"true"(see Auto-deploy for details).
By default, a new recommendation will applied once daily. You can change the schedule based on how closely you want to track CPU and memory utilization and your tolerance for churn.
To reduce pod churn, you can define thresholds to ensure only impactful recommendations are applied. Learn more in the Auto-deploy topic.
Configuring recommendations
You don’t need to configure much in Optimize Live because the machine learning does the work. But you can adjust several optimization settings, including:
- Recommendation schedule: This defines how often Optimize Live generates (and optionally applies) recommendations.
- Optimization goals for CPU and memory: Do you want more “aggressive” recommendations that optimize cost savings, less aggressive recommendations that ensure reliability, or a balance of the two?
- Optimization policy: For each container, you can choose what to optimize: requests, requests and limits, or neither.
- HPA target utilization: You can set this when an HPA is detected.
- Container-level thresholds: As mentioned above, thresholds ensure that only the most impactful recommendations are applied, which can help to reduce pod churn.
To learn more about setting these values at the cluster, namespace, and workload levels, as well as details about the settings themselves, see the topics under Configure optimization settings.
Recap
The Optimize Live UI gives you the flexibility to review the net impact of recommendations at the estate, cluster, namespace, workload, and container level.
Typically, scanning the Overview page gives you an idea of where to investigate further when you see an unusually large impact or unexpected results. You can drill down to the level you want to view and decide if it’s necessary to change any of the available optimization settings.
If you decide to change optimization settings at the cluster, namespace, or workload level, a best practice is to use annotations, however, you can also use the optional StormForge CLI.
Key points to remember:
- Rightsizing is more than just cost savings: It’s about making sure workloads run optimally.
- You’ll get the most out of Optimize Live when you let Optimize Live apply recommendations automatically.
By letting Optimize Live machine learning rightsize the workloads in your estate, you’ll see fast time to value and remove the toil of thinking about — and setting — the optimal Kubernetes requests values.
Installing the StormForge Agent on your cluster takes less than one minute - and with a 30-day free trial, you can try it out for yourself. Sign up for free at app.stormforge.io/signup. To preview the installation steps, see Install the Agent.