UI enhancements
Added
- Graphs showing overview data over time
On the new Reports page, you can now view graphs that show recommendation impact data for your entire estate over a time range of 2 weeks, 1 month, or 3 months:-
Current and recommended requests totals for both CPU and memory
-
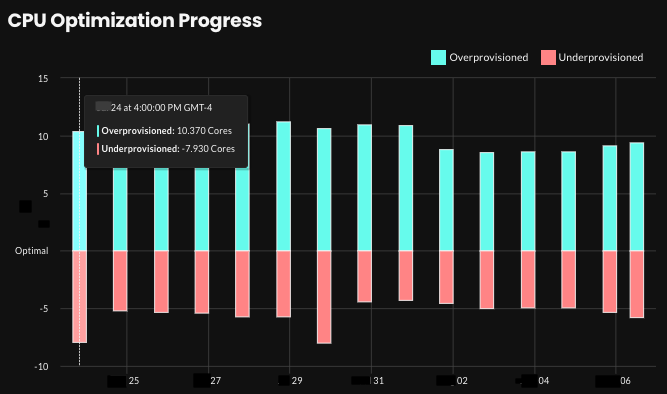
Optimization progress showing the number of overprovisioned/underprovisioned workloads
-
Estimated monthly resource costs
-
Workload count
Example:
-
Changed
-
Improved recommendation details view
On the Recommendation tab on the workload details page, recommended container values are now stacked along the left side of the pane, making it easier to view recommended values. Clicking a container name still reveals the Average CPU/Memory Usage, Requests, and Limits graphs.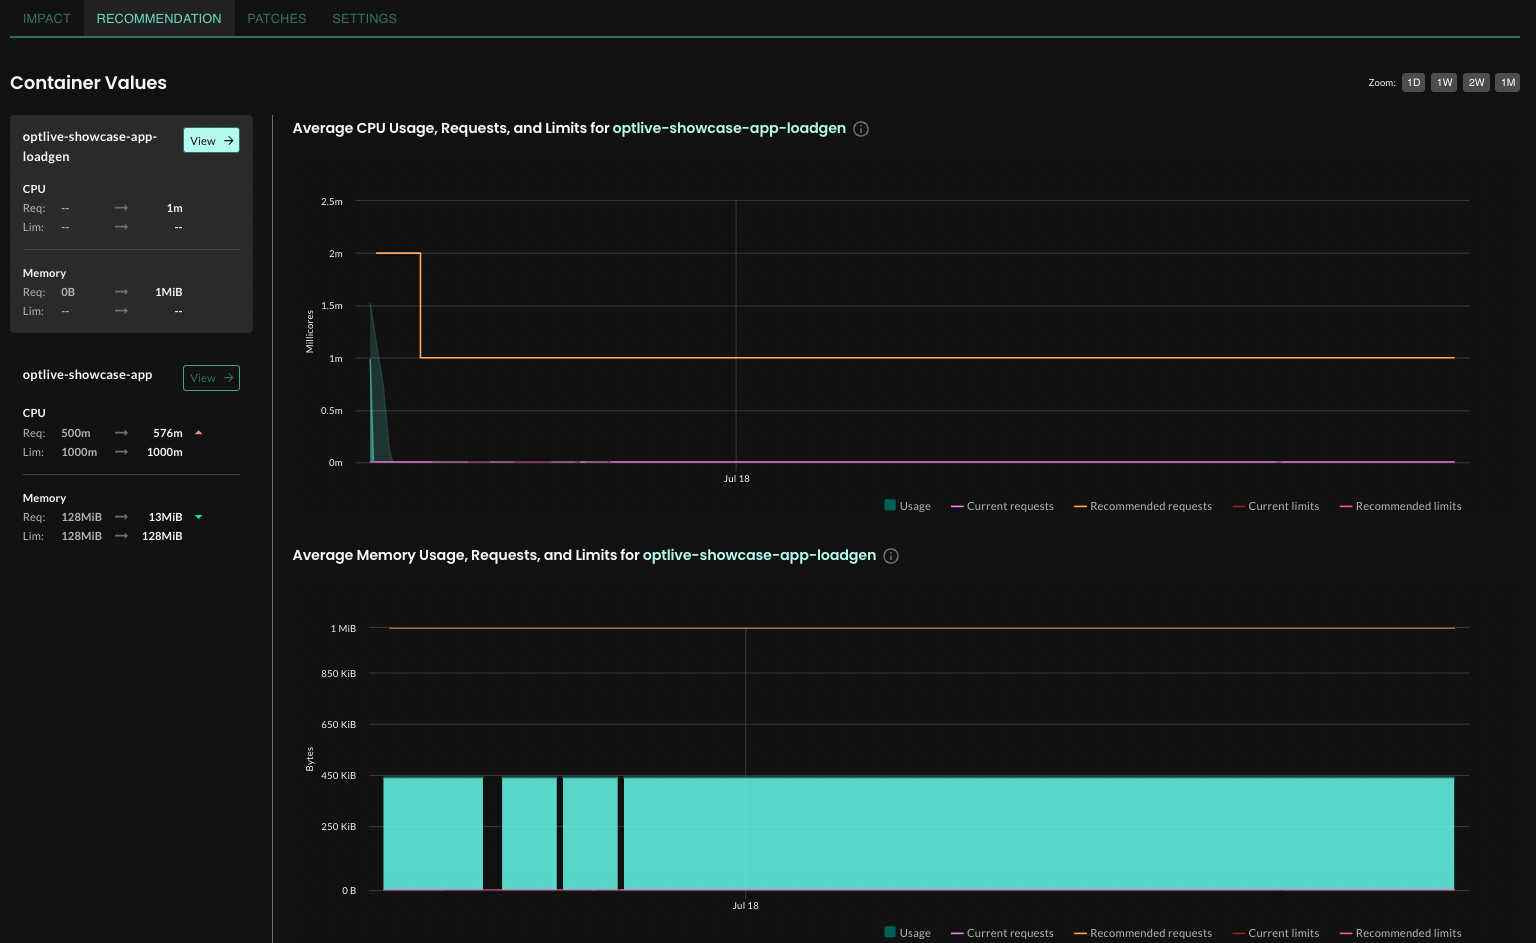
Last modified October 16, 2024